

Utilities and infrastructure companies own very long dated assets characterised by high up front capital costs and returns often correlated to economic parameters. As such their valuations can be sensitive to changes in long term bond yields, some sectors more than others.
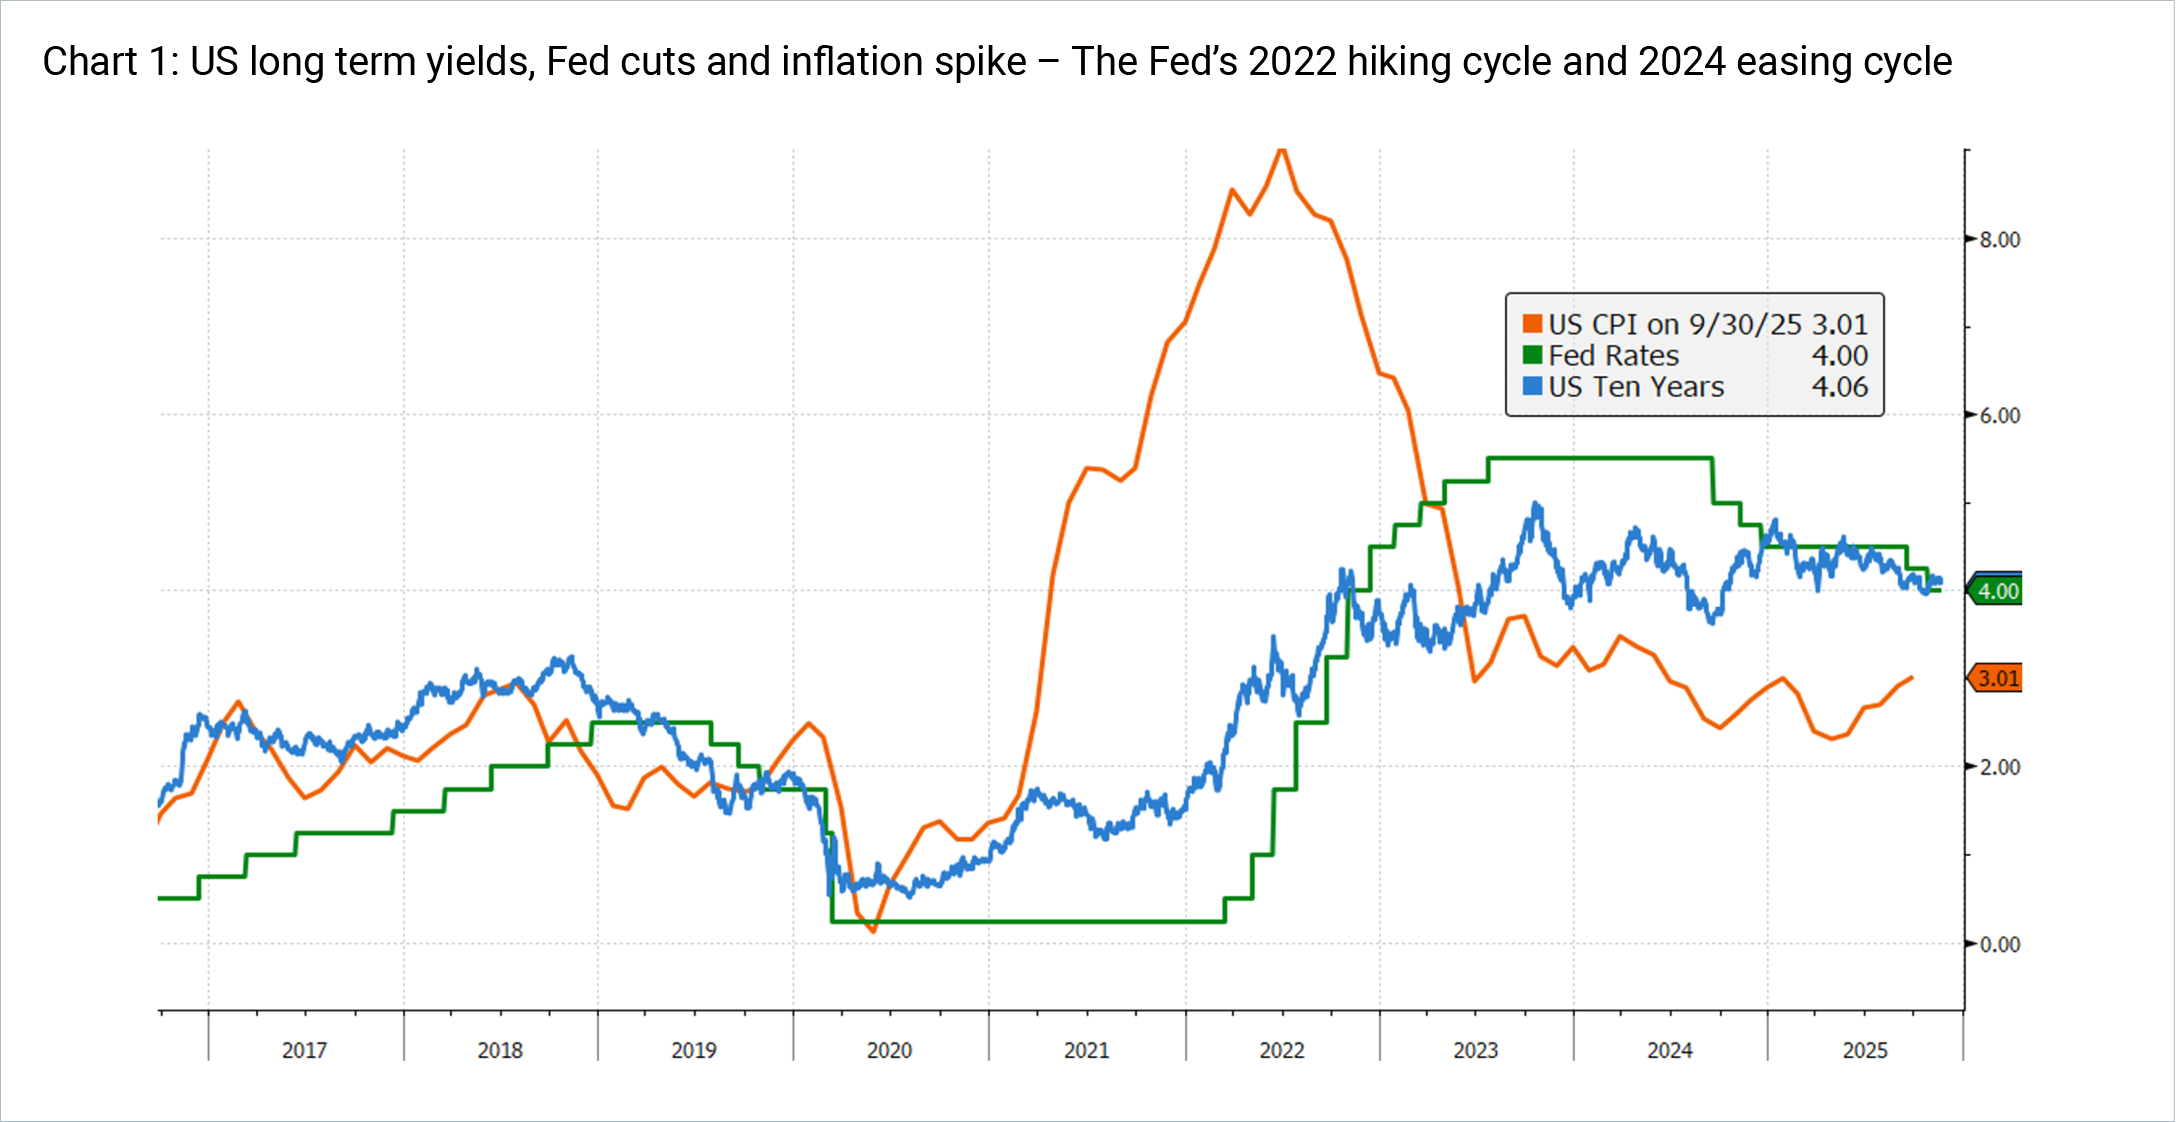
The sharp inflation spike of 2021-22 led the US Fed to raise rates at a record pace, from 0.25% to 5.5% over 18 months, representing a headwind for certain segments of the infrastructure universe, particularly US utilities (no explicit inflation or interest rate pass through). Positively, this Fed action reigned in inflation and market expectations turned to Fed cuts. The subsequent easing cycle, commencing in September 2024, was expected to be a tailwind for infrastructure and in particular for utilities that have strong fundamental linkages to interest rates.
While Fed interest rate cuts of at least 25bps generally coincide with a decline in long term bond yields this easing cycle has proved to be an anomaly: the Fed has cut by a cumulative 150bps and US ten-year yields have risen by ~50bps.
In this News & Views we investigate what has driven this increase, if it can be sustained and the outlook from here. Finally, we then assess the impact this has on global listed infrastructure (GLI) valuations and how 4D manages these risks and opportunities.
Bond yields – short & long term, components & moves after Fed cuts
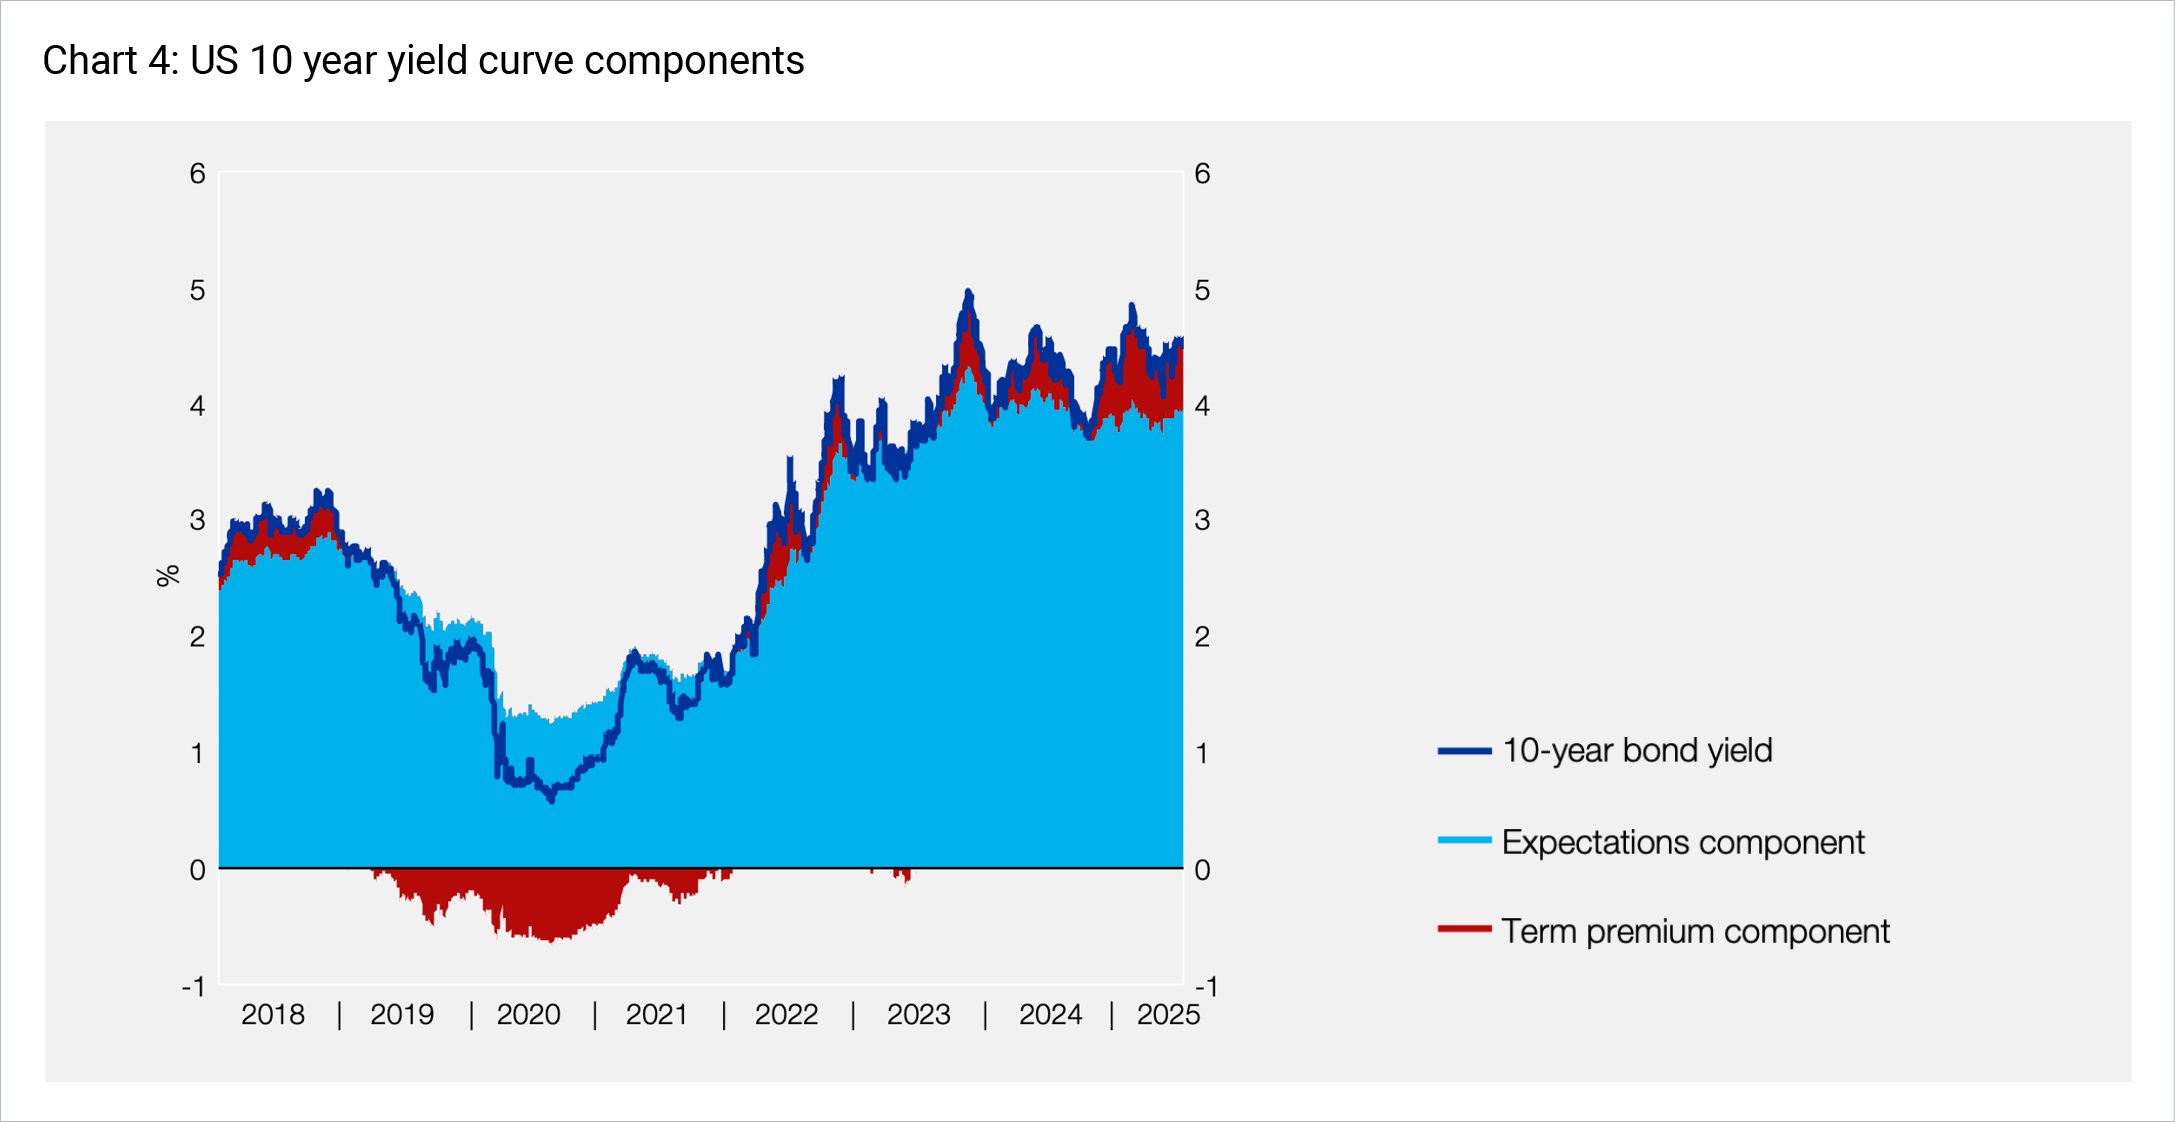
Short term yields are mainly driven by central bank policy rates and near-term inflation and growth expectations. By contrast, long term yields reflect expected future short-term rates as well as longer-run views on inflation, growth and a ‘term premium’ for compensating investors for the risk of holding longer dated bonds. Specifically, recent studies on the parameters affecting bond yields across maturities point to two key components:
- the ‘expectations component’ of policy rates, which are influenced by economic growth and inflation expectations, and
- the ‘term premium component’ which reflects policy rate path uncertainty until maturity, which increases as the bond’s maturity increases1.
As an infrastructure investor, the level and direction of long term yields are more important to us than short term moves as they have the largest impact on valuations, portfolio construction and risk management.
As mentioned above, the inflation spike from very loose COVID monetary and fiscal policies led to a very steep Fed rate hiking cycle in 2022. The subsequent fall in inflation from above 9% to towards the Fed’s 3% target led to the shifting of market expectations to an easing cycle.
 Source: 4D, Bloomberg as at 20/11/25M
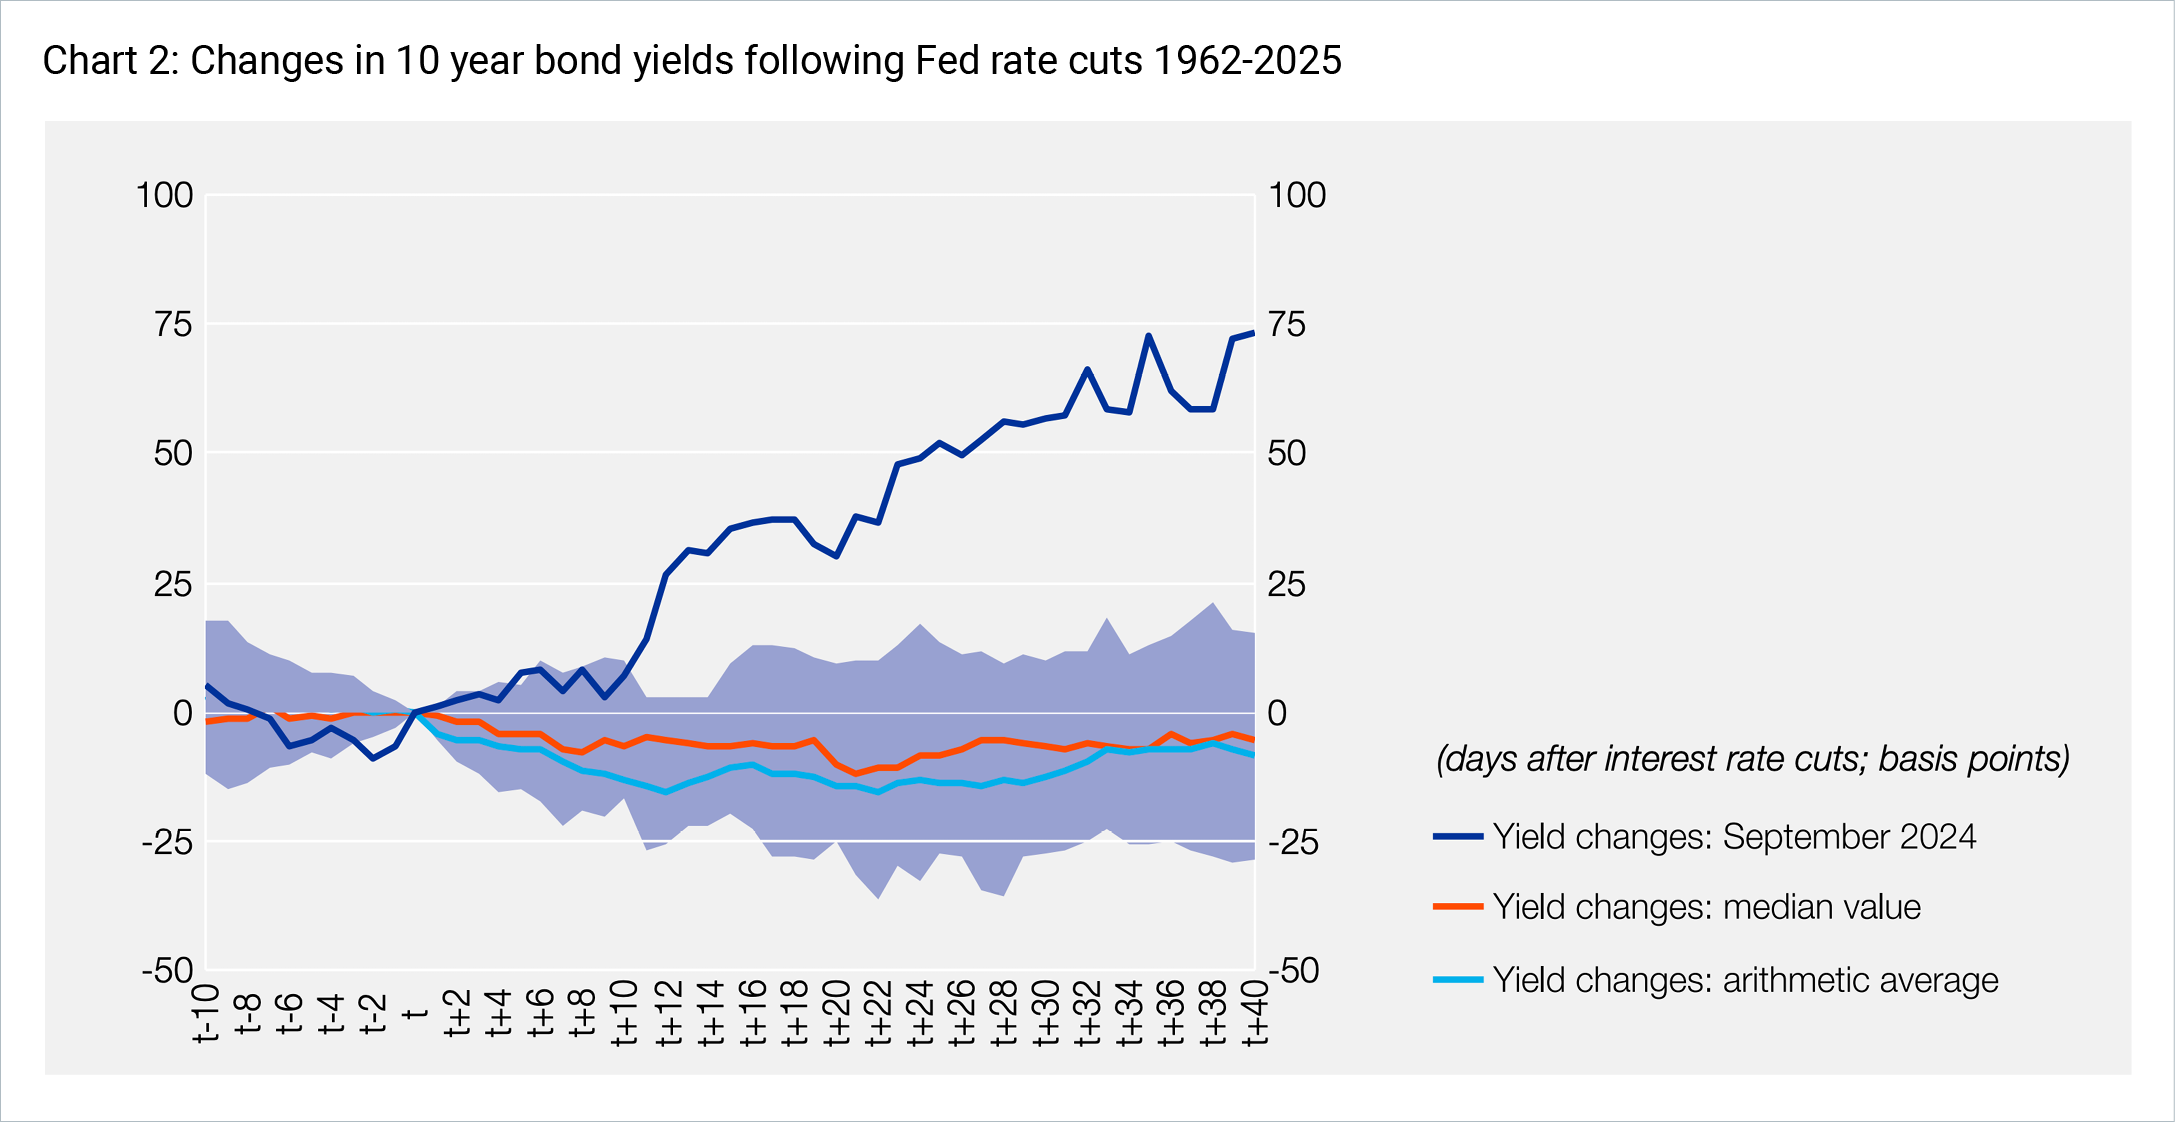
According to central bank research, since the 1960s Fed cuts of at least 25bps are followed by an average decline in long term bond yields of 10-16bps over the following calendar month, before stabilising at the lower level.2 This can be seen in the lower blue and red lines in Chart 2 below.
 Source: Bank of Greece, Federal Reserve Bank of Saint Louis and LSEG
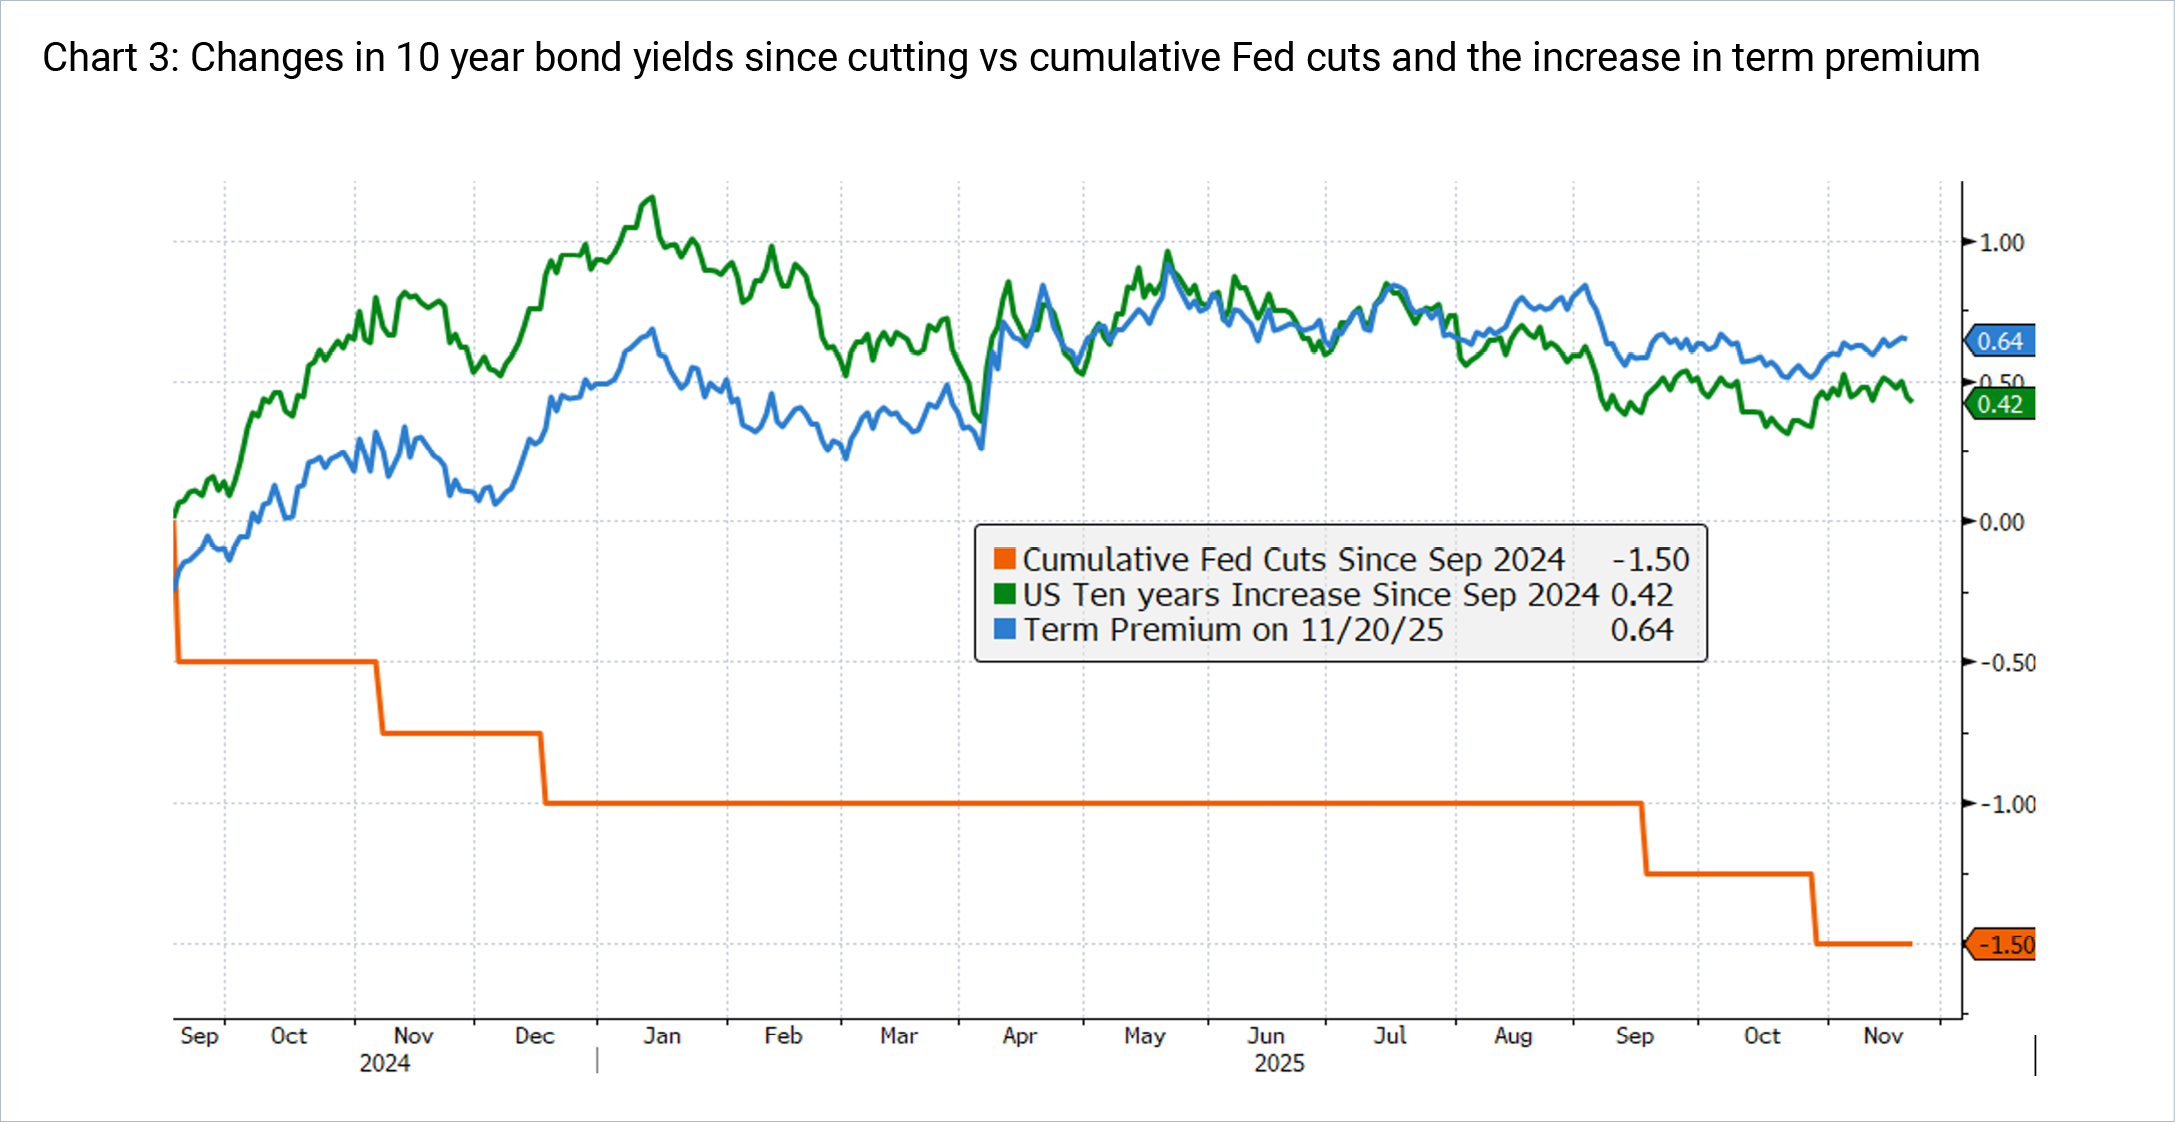
The market movements since the Fed started cutting in September 2024 have been very different to the historical price action seen above. As can be seen in Chart 3, as at November 2025 the Fed has cut 150bps while 10 year yields have increased 42bps. This move is rare – with this level of increase in the upper 10% of historical observations in the chart above, where the dark purple shaded area is the 25%-75% range of observations in the distribution.
 Source: 4D, Bloomberg as at 20/11/25
In order to investigate the reasons for the long bond yield increase, we can split up the components of the yield into its expectations component and term premium (explained above). We can see that over this recent period, the expectations component was largely stable (the light blue in Chart 4).
 Source: Bank of Greece, Federal Reserve Bank of Saint Louis and LSEG
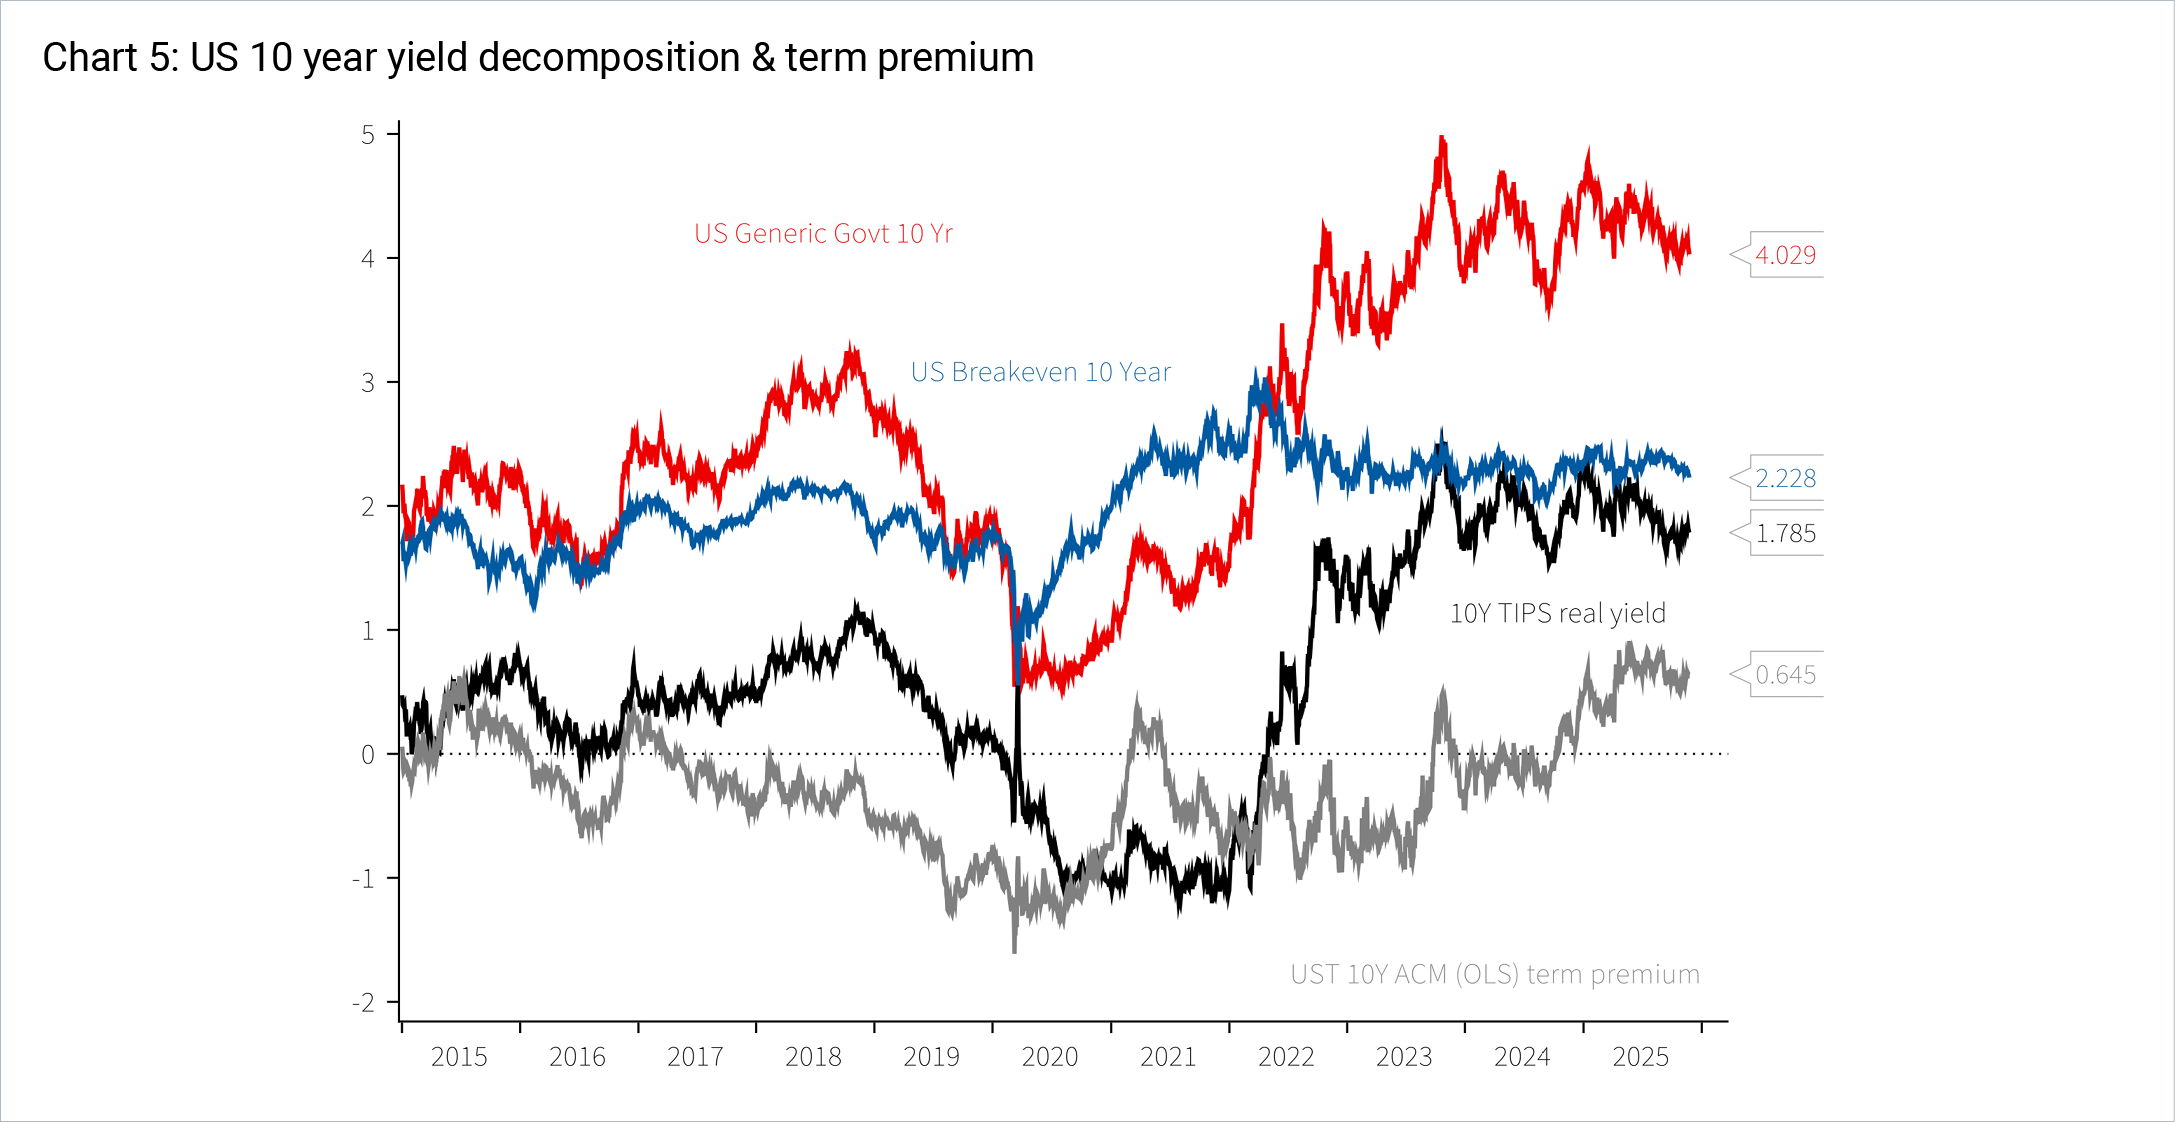
Furthermore, as can be seen in Chart 5, inflation expectations have stayed broadly stable too, indicated by the US breakeven below in blue.
 Source: NAB, Bloomberg, Fed Reserve Bank of New York, Macrobond
This implies that an increase in term premium has caused a steepening of the yield curve, despite short rates dropping since September 2024.
The term premium
Over 2025 there has been a lot of debate among central bankers, academics and market participants, as to the cause of the increase in term premiums by 50-100bps since the Fed’s easing cycle began in 2024.
Arguments include:
- Uncertainty around US economic policy, heightened by Trump’s tariff announcements since coming into office and peaking on ‘Liberation Day’ in April. These interventions lead to greater variability of potential growth and inflation outcomes in the short and long term.
- Elevated levels of budget deficits, culminating in the passing of the One Big Beautiful Bill Act (OBBBA) and worsening national debt metrics (debt to GDP) in the medium term (at least).
- Any perceived interference in the Fed’s independence is likely to lead to steepening, due to increased uncertainty in the policy and growth path. Trump sought to fire Fed Governor Lisa Cook in August 2025, and has made many disparaging remarks about Fed Chairman Powell throughout his second Presidential term.
- Expectations of elevated inflation and inflation upside risks (ie the presence of upside risks increasing, even if expectations have not actually increased).
Other reasons for a steepening in the curve:
- Stronger than expected economic growth has led investors to demand higher compensation for inflation and growth risks longer term.
- Supply and demand dynamics; as per JP Morgan3 “We’ve argued for the last two years that the rapid growth of the Treasury market has outstripped demand from the Fed, foreign investors, and banks, which had comprised a 60-70% share of ownership of the Treasury market in the post-GFC era, and their share is set to decline further”.
- Over the past decade, Quantitative Easing (QE) played a crucial role in compressing sovereign risk premiums to historically low levels. However, as QE came to an end, it triggered a normalisation of the term premium, leaving fiscally constrained countries more exposed to market volatility on the long end4.
US Fed Governor Michelle Bowman summed up another risk of higher yields brought on by higher term premiums in a speech on 26 September 2025:
Term premiums…A second challenge for monetary policy would be a significant rise in longer-term interest rates driven by higher term premiums, which could offset a reduction in the expectations component stemming from monetary policy easing. This scenario would weaken the transmission of changes in the policy rate to economic activity, as investment decisions of households and businesses are dependent on longer-term rates, such as mortgage rates and corporate bond yields.5
While the term premium has risen sharply, and many are looking for reasons why, it is worth noting that it remains below levels that persisted prior to the GFC. As JP Morgan note, “while this is a big move, it is not unexpected: term premium has retraced closer to average levels observed in the decade prior to the GFC, and does not seem to be unduly high in our opinion right now. Moreover, the demand for longer duration assets seems to be receding globally now as well”.
Transmission mechanism to the rest of the world
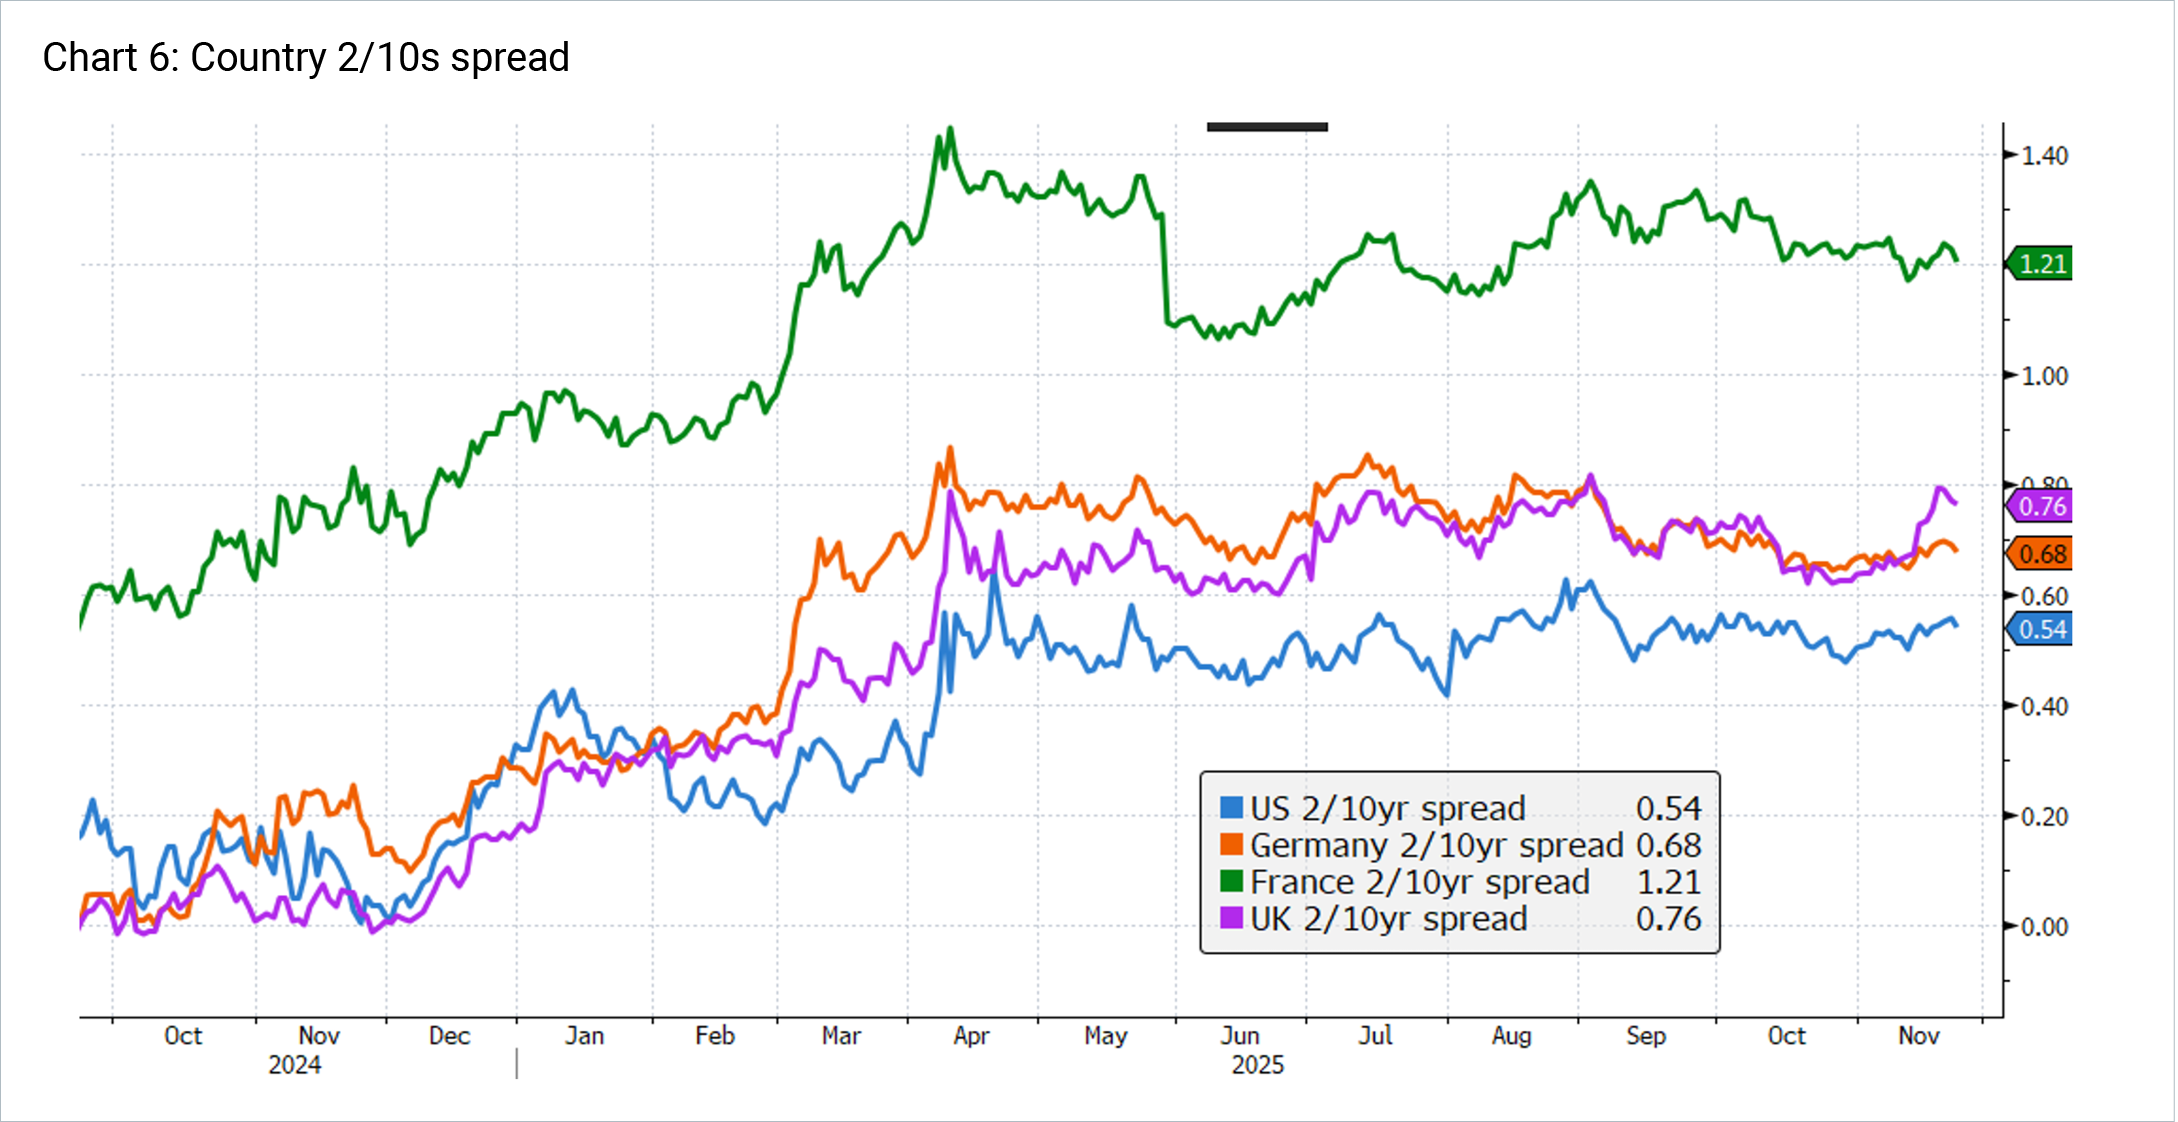
The steeper yield curve has not been isolated to the US. As seen below, German, French and UK yields have also been steepening over the last 18 months – evidenced by the spread between the 2 and 10 year yields. Part of this has been the linkages in sovereign debt markets with the US, while other drivers are country specific. These all include common traits of worsening debt metrics and political impasse:
- French political uncertainty increasing the ongoing fiscal and budget challenges, which increase the term premium on long dated bonds.
- UK budget concerns, which led to a spike in long bonds, due to political inability to reign in spending.
- In Germany, a record fiscal package (ie the defence and infrastructure stimulus package) was announced and is expected to historically widen the German fiscal deficit, while boosting growth.
 Source: 4D, Bloomberg
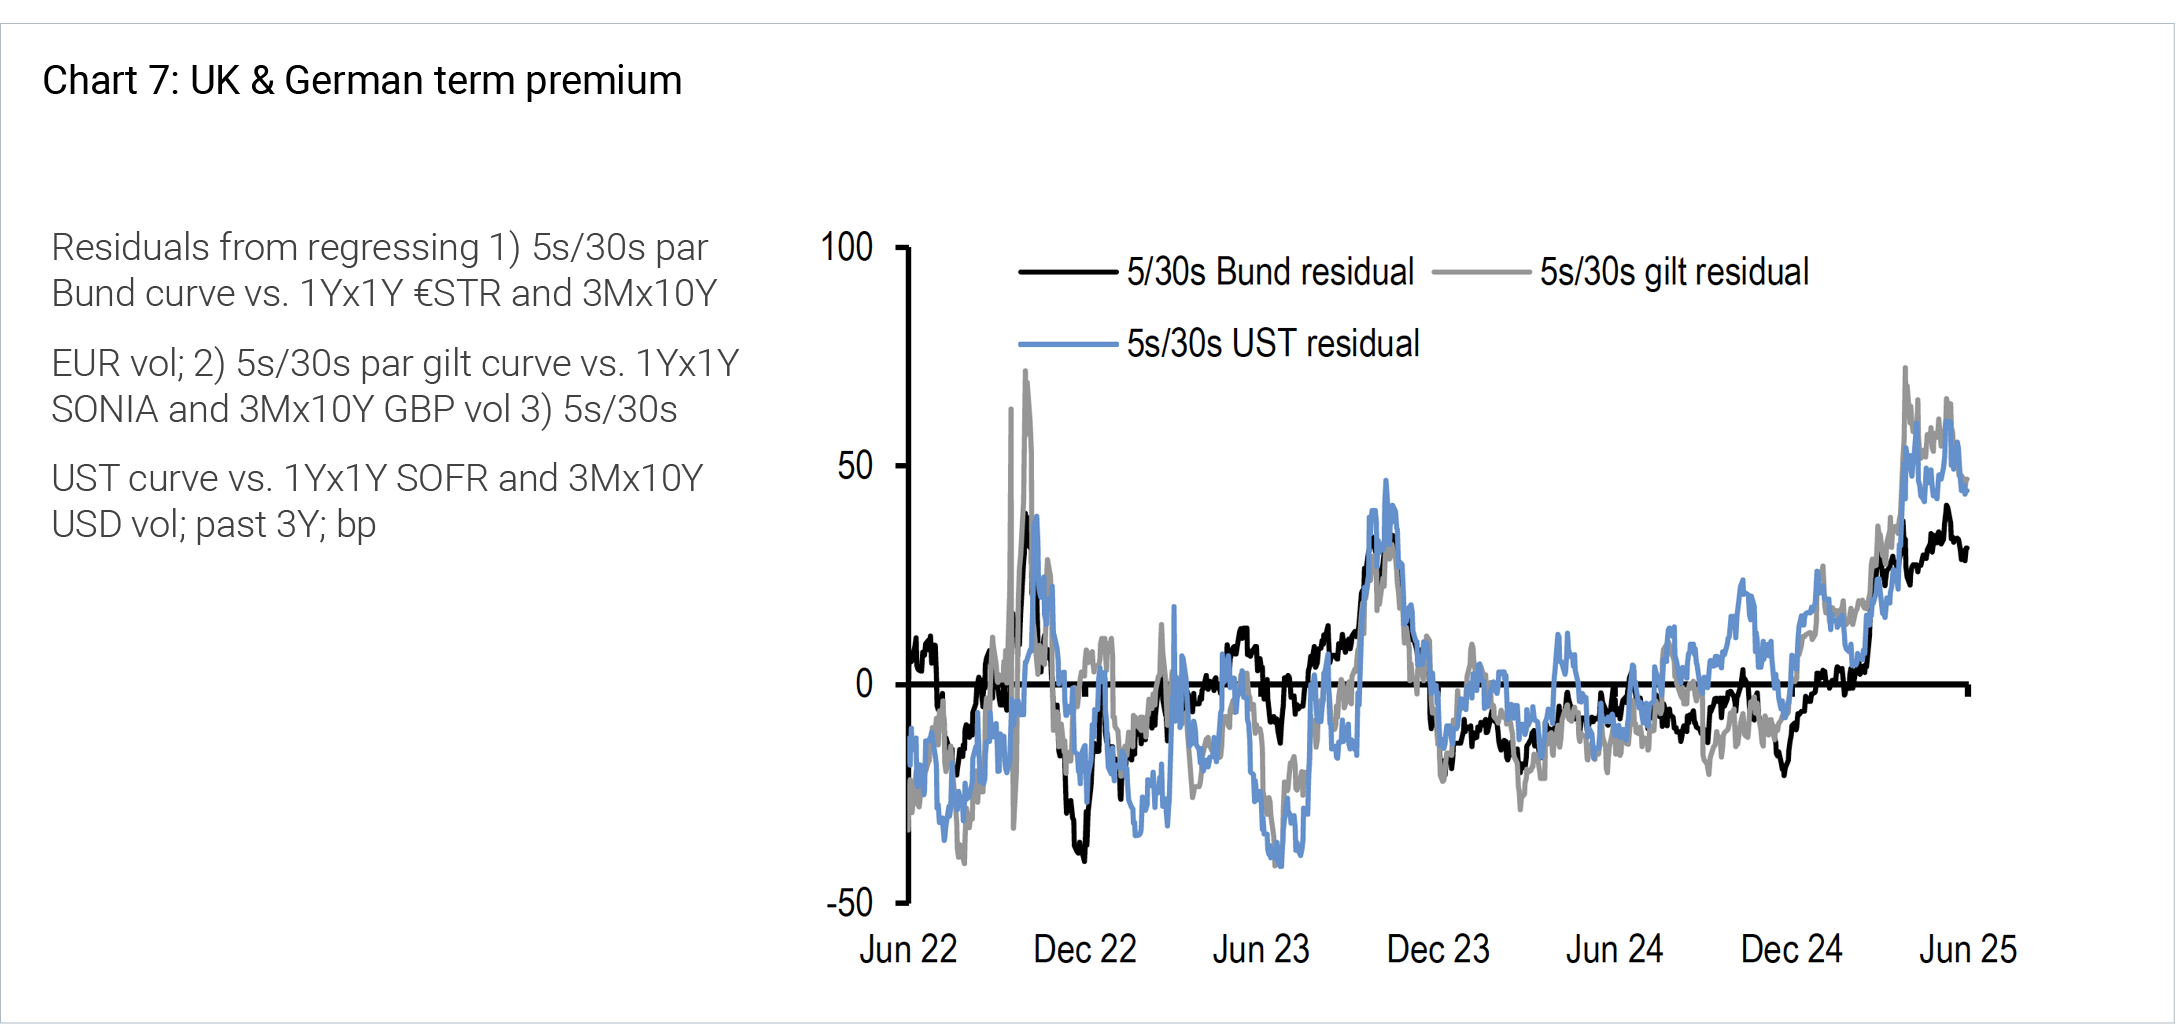
Likewise, JP Morgan analysis estimates the term premium for these economies, despite fiscal idiosyncrasies between them, remain well correlated.
 Source: JP Morgan
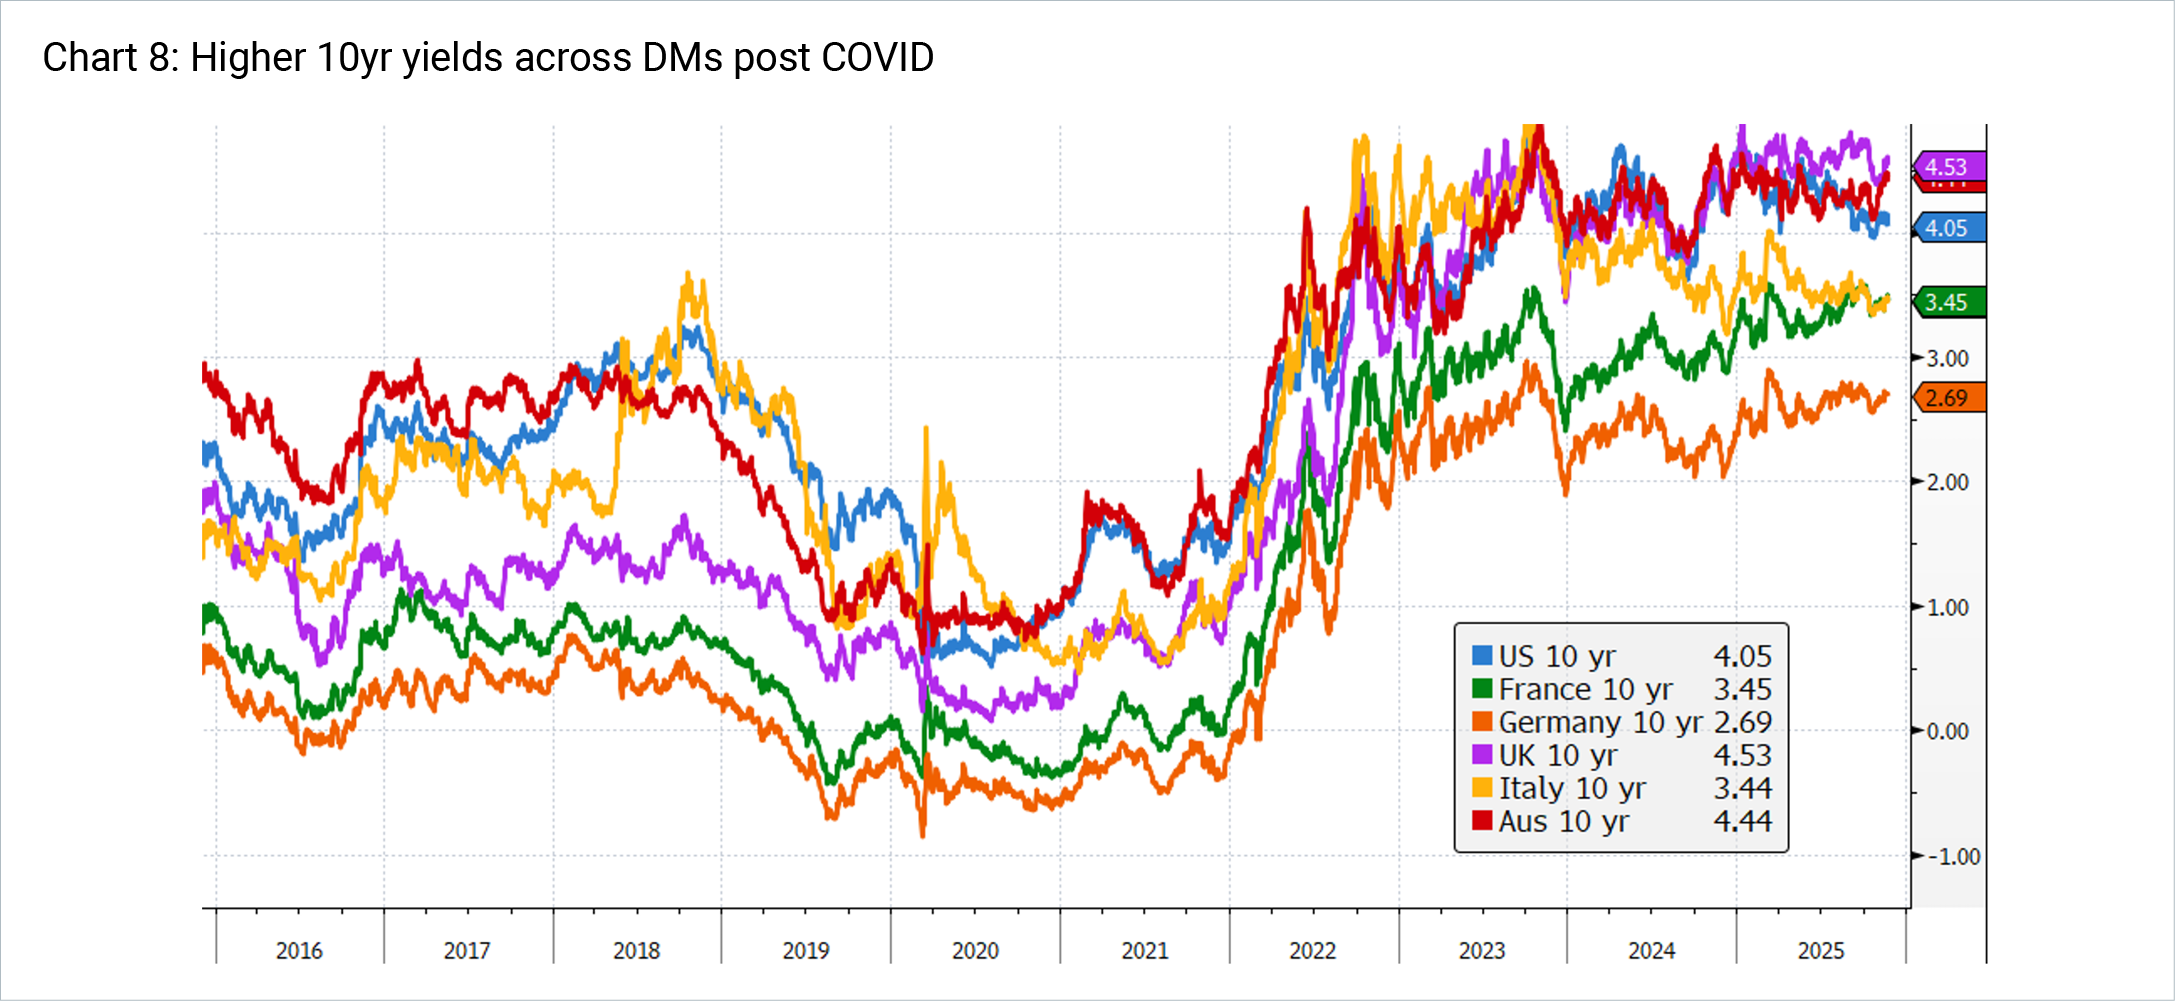
At an absolute level, long bond yields across developed economies remain higher than pre-COVID. In part this is because of higher long run neutral rates (known as r*), due to structurally higher inflation expectations (less global slack), as well as larger government deficits, higher investment needs and more issuance.
 Source: 4D, Bloomberg
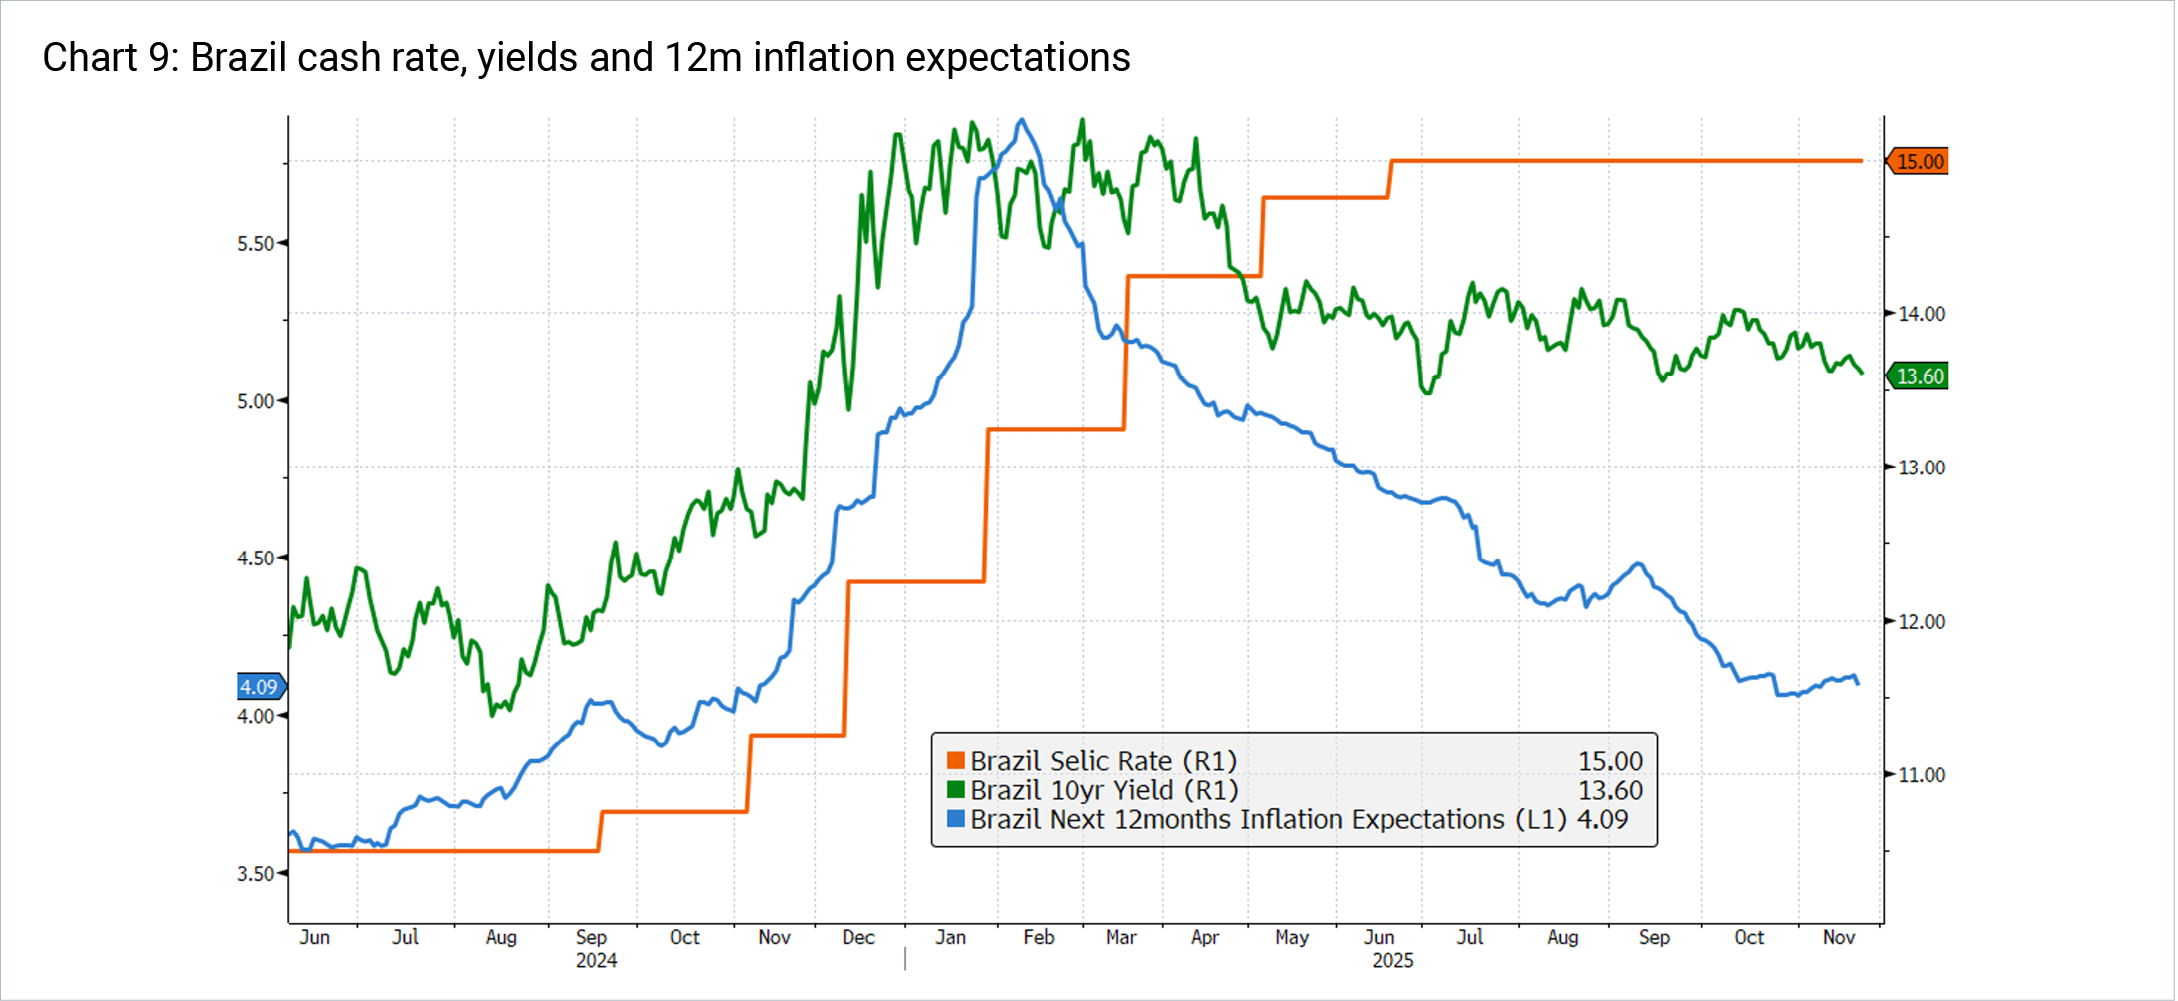
By contrast, Brazil has reported the opposite moves in short term cash rates and long term yields. From mid 2024 the central bank aggressively raised the SELIC rate 450bps to 15% to combat rising inflation expectations due to market expectations of lower government fiscal discipline and constraint around annual budget planning. This aggressive hiking cycle, while painful, also aimed to cool strong domestic economic growth. To date this has proved successful, with inflation expectations coming back down towards the target range. Since the start of 2025 cash rates are up 275bps and 10 year yields have actually fallen 120bps. A key reason for this, according to Bloomberg’s Brazilian Economist, is the ultra hawkish approach has actually given the central bank a credibility boost, which has reduced the risk perception and lowered inflation expectations. Looking at the 5 year rate, which declined to 13.2% from 15.5% at the start of the year (even as policy rates rose 275bps), Bloomberg states that their “model attributes 150bps of the cumulative 240bp drop to an improvement in risk factors. In our view, this largely reflects reduced concerns over monetary policy making under Gabriel Galipolo, who became central bank governor in January for a 4 year term” 6
 Source: 4D, Bloomberg
Why this matters – the relationship between infrastructure values and yields
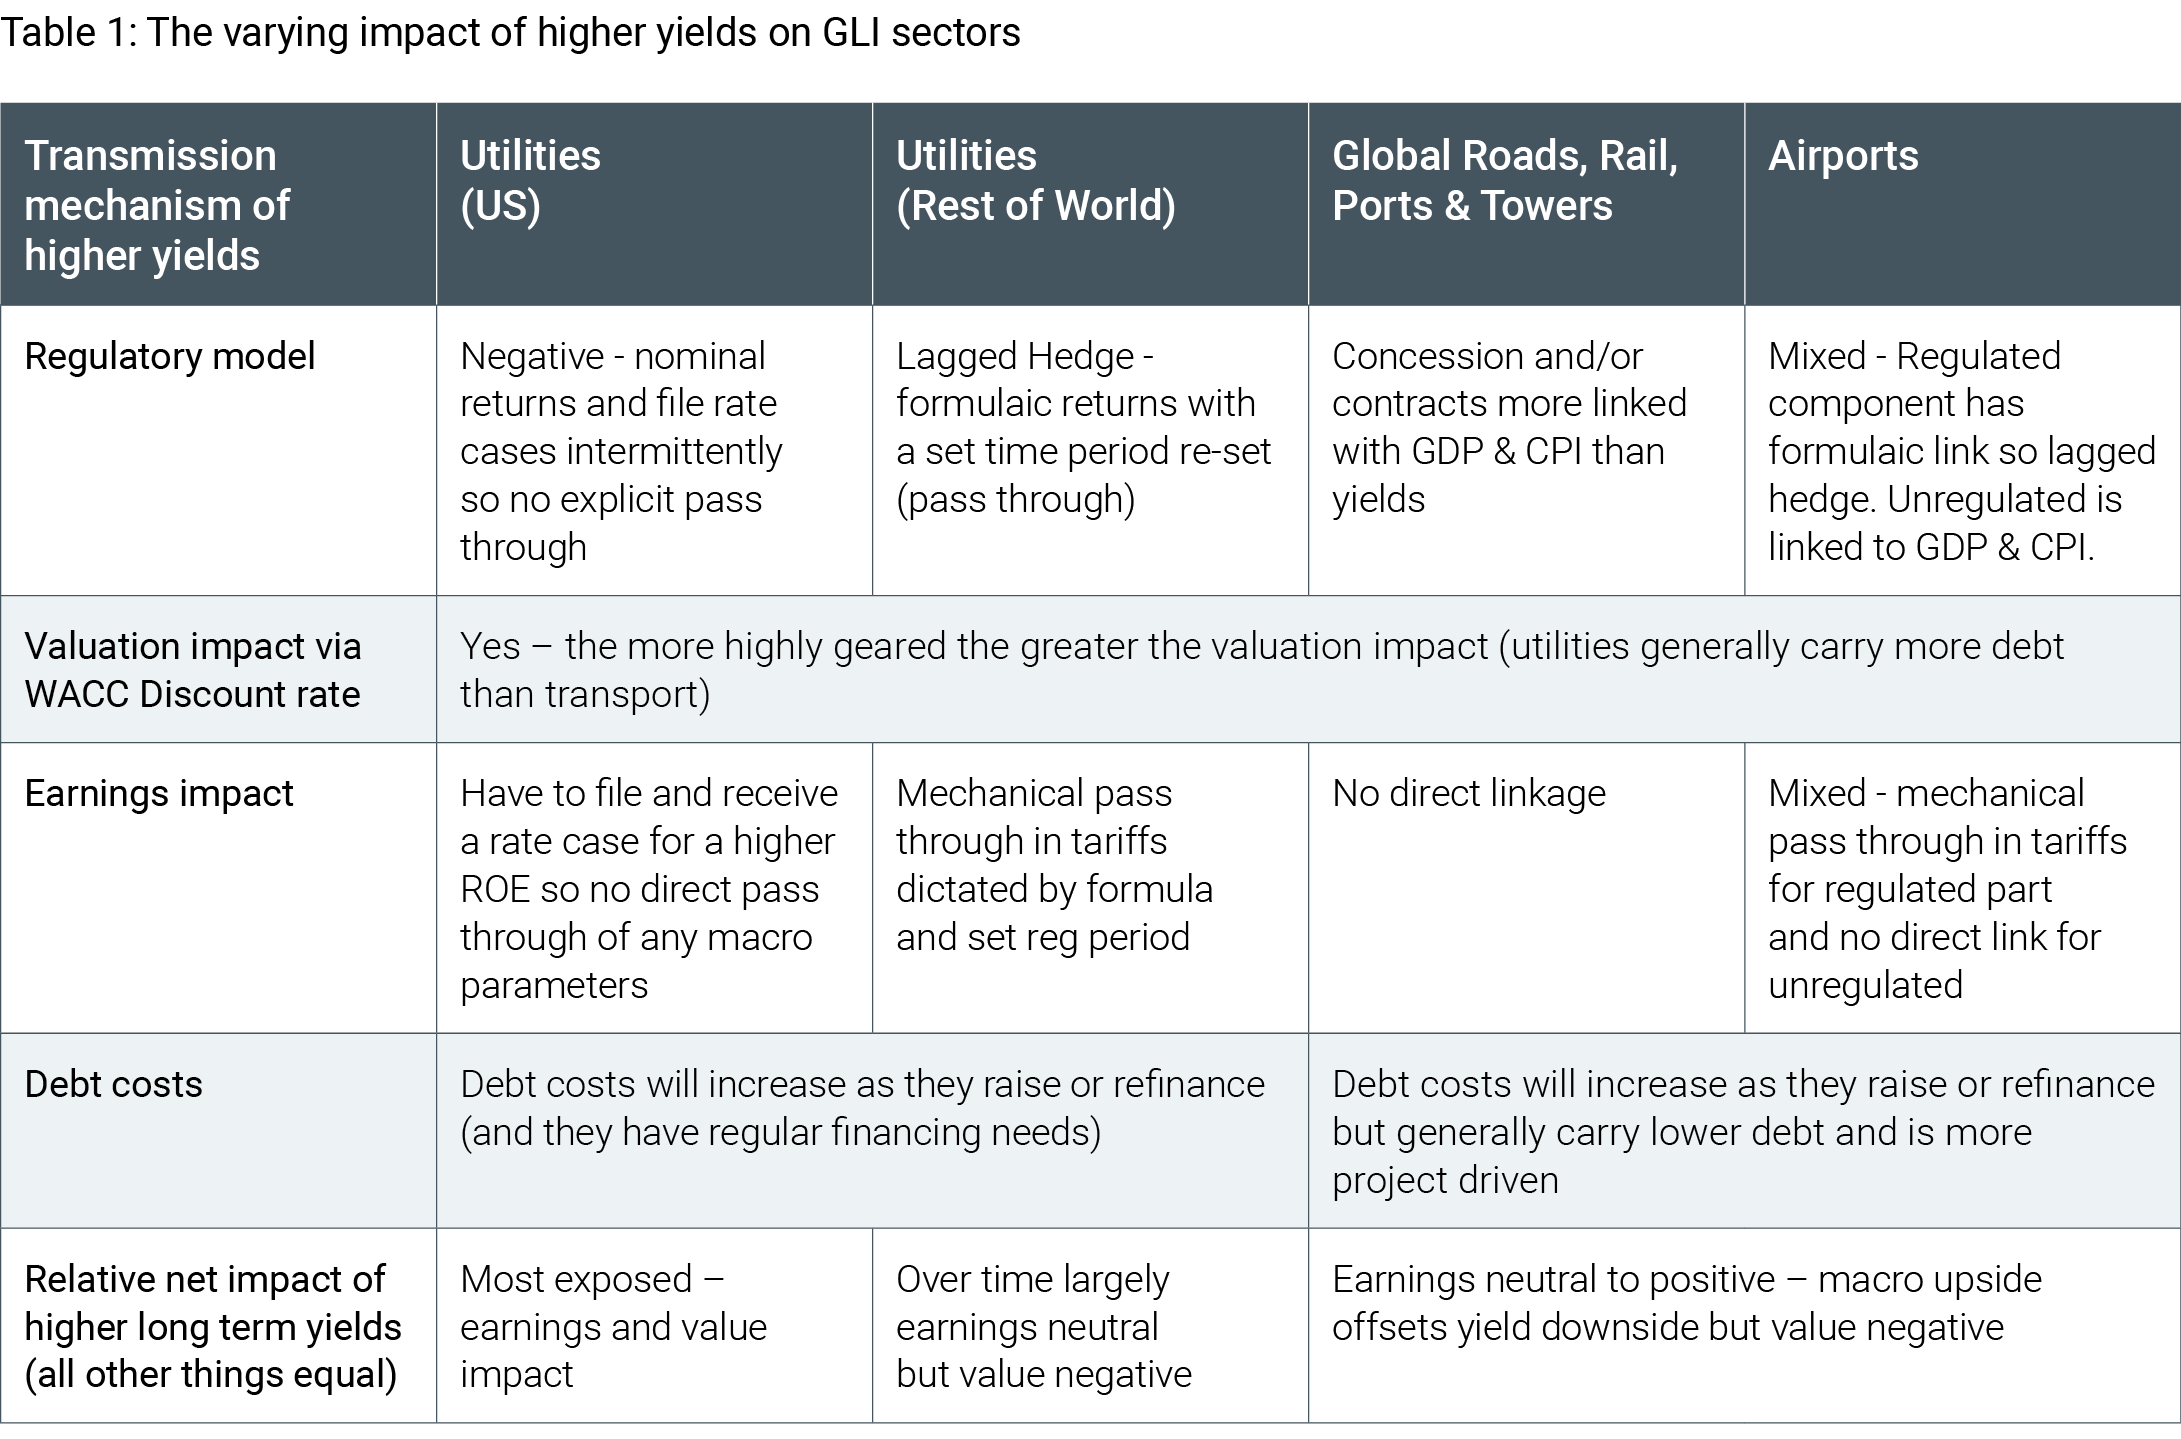
At 4D, we use long bond yields to discount the cashflows from these long duration assets. Therefore, a steeper curve – as well as a permanently higher curve – has an impact on valuations of infrastructure assets as a simple function of discount rates. It also impacts fundamental cash flow modelling through forecast regulated return profiles, inflation expectations and borrowing costs, as well as the ability to borrow. In very general terms, it has a greater impact on the utility segment relative to other sub-sectors due to its greater correlation to economic indicators like government yields (as a building block of regulated returns) and in some cases inflation.
This is where stock and sector selection within the GLI universe becomes crucial, and a truly active approach to investing is highly valuable.
Across the global infrastructure universe 4D has the ability to shift between geographies and sectors where there is more or less sensitivity to long bond moves (both steepness and level of change) and look for exposures that can fundamentally capitalise on moves better than others – as well as exposures with greater ability to pass through inflation, serving to mitigate the impact of higher rates alone.
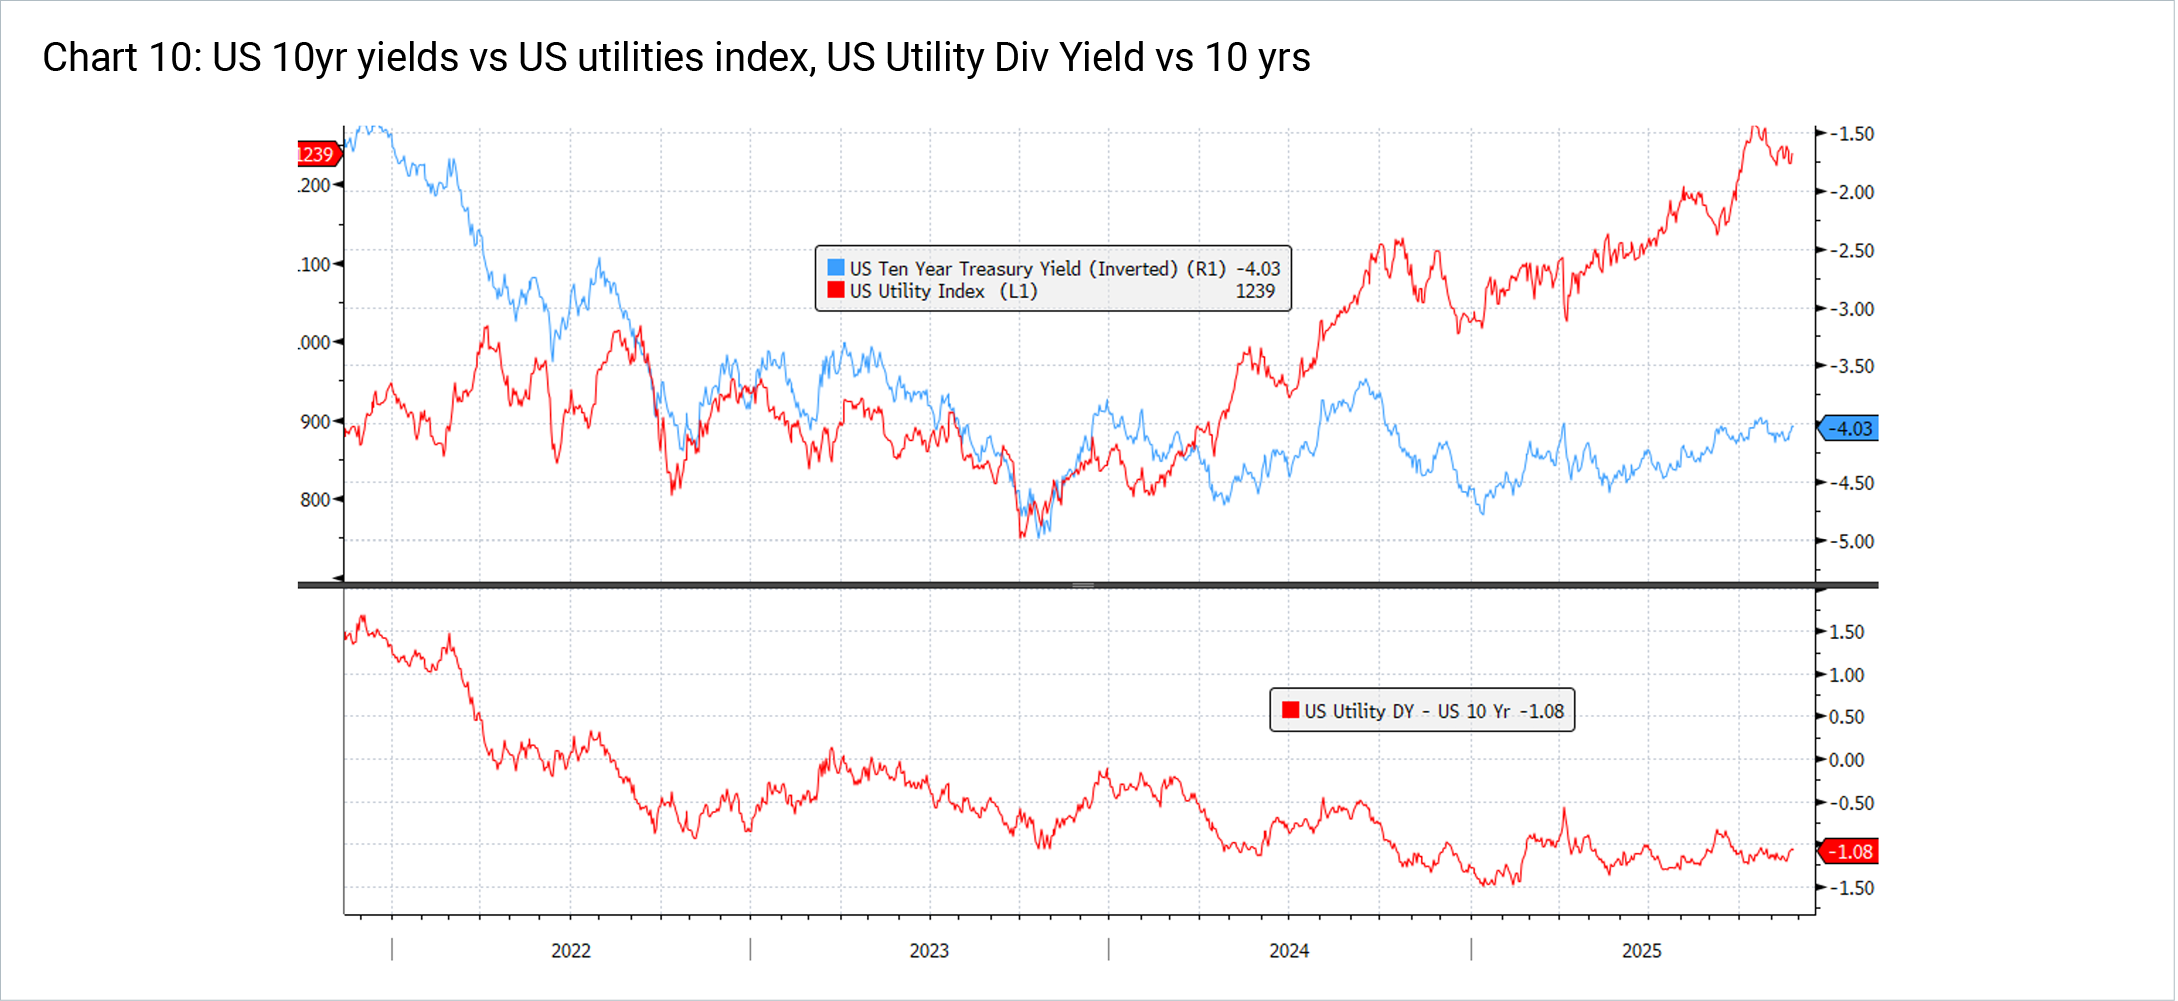
Also, ignoring sentiment and historic correlations, a number of sector dynamics are supporting fundamental growth outside historical long term yield dynamics. This is particularly relevant for the utility sector which is undergoing a seismic shift in investment mandates to support AI and data centre themes (US) and/or network upgrades to support energy transition and replacement spend (Europe). As such, the historic tight correlation of utility share price performance with yields is potentially no longer warranted, as seen in Chart 11 from early 2024.
 Source: 4D, Bloomberg
Conclusion
One must be careful not to naively assume the Fed’s easing cycle is a slam dunk for long duration assets such as utilities and infrastructure assets. The long end of the curve drives GLI valuations more than the short end, and since the Fed started cutting rates in 2024 we have witnessed something rare by historical standards – an increase in long term yields. This has been driven by an increase in the term premium, due to increased political and economic uncertainty, worsening debt metrics, long term budget outlooks and supply-demand dynamics. At 4D we monitor these risks and construct and actively manage a portfolio to balance the risks and opportunities across geographies and sectors. Furthermore, with an active approach to portfolio construction, we can target exposures with idiosyncratic drivers of earnings growth to offset these factors, such as those seen in the networks businesses globally.
1 Examples include Adrian, Crump and Moench (2013), “Pricing the term structure with linear regressions”, Journal of Financial Economics, and Gurkaynak, Sack and Wright (2007), “The U.S. Treasury yield curve: 1961 to the present”, Journal of Monetary Economics
2 Bank of Greece Eurosystem, Monetary Policy 2024-25, Executive Summary & Boxes, June 2025
3 JP Morgan “2025 Mid Year Outlook”, Global Research June 2025
4 ABN Amro “Can France dig itself out of a fiscal hole?”, Bill Diviney 6 November 2025
5 “Thoughts on Monetary Policy Decision making and Challenges Ahead”, Fed Governor Bowman, 26 September 2025
6 Bloomberg “BCB Integrity Boost = Rates up, Yields down”, 25 November 2025
The content contained in this article represents the opinions of the authors. This commentary in no way constitutes a solicitation of business or investment advice. It is intended solely as an avenue for the authors to express their personal views on investing and for the entertainment of the reader.