

The COVID-19 pandemic has very likely pushed the international economy into recession and cut a swathe through global equity markets. From 21 February through to the end of March 2020, the US S&P 500 equity index was down 23.2% and the MSCI World index was down 23.1%.
Listed infrastructure has certainly not been immune to this value erosion, with the infrastructure indices down 18-32% over the same period. This price weakness could continue for a while yet, until it becomes clearer that health authorities around the world are getting on top of the outbreak. However, it is important to remember that infrastructure is a very long duration asset with a 5-10+ year investment horizon. Indeed, once we move past the worst impacts of the virus and the world’s economy returns to a more stable environment, infrastructure, in all its forms, will be integral to the economic recovery and returning society to ‘situation normal’. There is no global growth recovery without roads, railways, pipelines, power transmission networks, communication infrastructure, ports and airports.
In this paper Sarah Shaw, Chief Investment Officer and Global Portfolio Manager from 4D Infrastructure, revisits listed infrastructure’s unique and compelling characteristics, outlining why 4D continues to love the sector and why we believe it will be central to the global economic recovery when it comes. Sarah then provides an overview of how far some of the key infrastructure sectors and stocks have fallen in the COVID-19 equity market sell-off. Blending these two thematics, and given the extent to which the market has already fallen, she concludes that we are indeed at the precipice of a real investment opportunity in listed infrastructure over the coming 6-12 months.
1. Introduction
Infrastructure as an asset class is increasingly on the radar of investors and their advisers. In the face of the COVID-19 pandemic, we remain optimistic about the prospects for the global listed infrastructure (GLI) asset class in 2020 and beyond. Indeed, we believe infrastructure will be integral to the global recovery on the other side of the current health crisis.
2. GLI’s key characteristics and driving global thematics
Infrastructure provides basic services essential for communities to function and for economies to prosper and grow. For us at 4D Infrastructure, this equates to the publicly listed owners and operators of essential services (regulated utilities in gas, power and water); and user pay assets (toll roads, airports, ports, rail where a user pays for the service).
Infrastructure’s key characteristics
At 4D we look for assets with the following qualities:
- monopolistic market positions, or ones with high barriers to entry;
- returns under pinned by regulation or contract;
- a largely fixed operating cost base;
- high up-front capital costs and then very low ongoing maintenance spend;
- inflation hedges within the business;
- long dated, resilient and visible earnings and cash flows; and
- an attractive yield or potential yield.
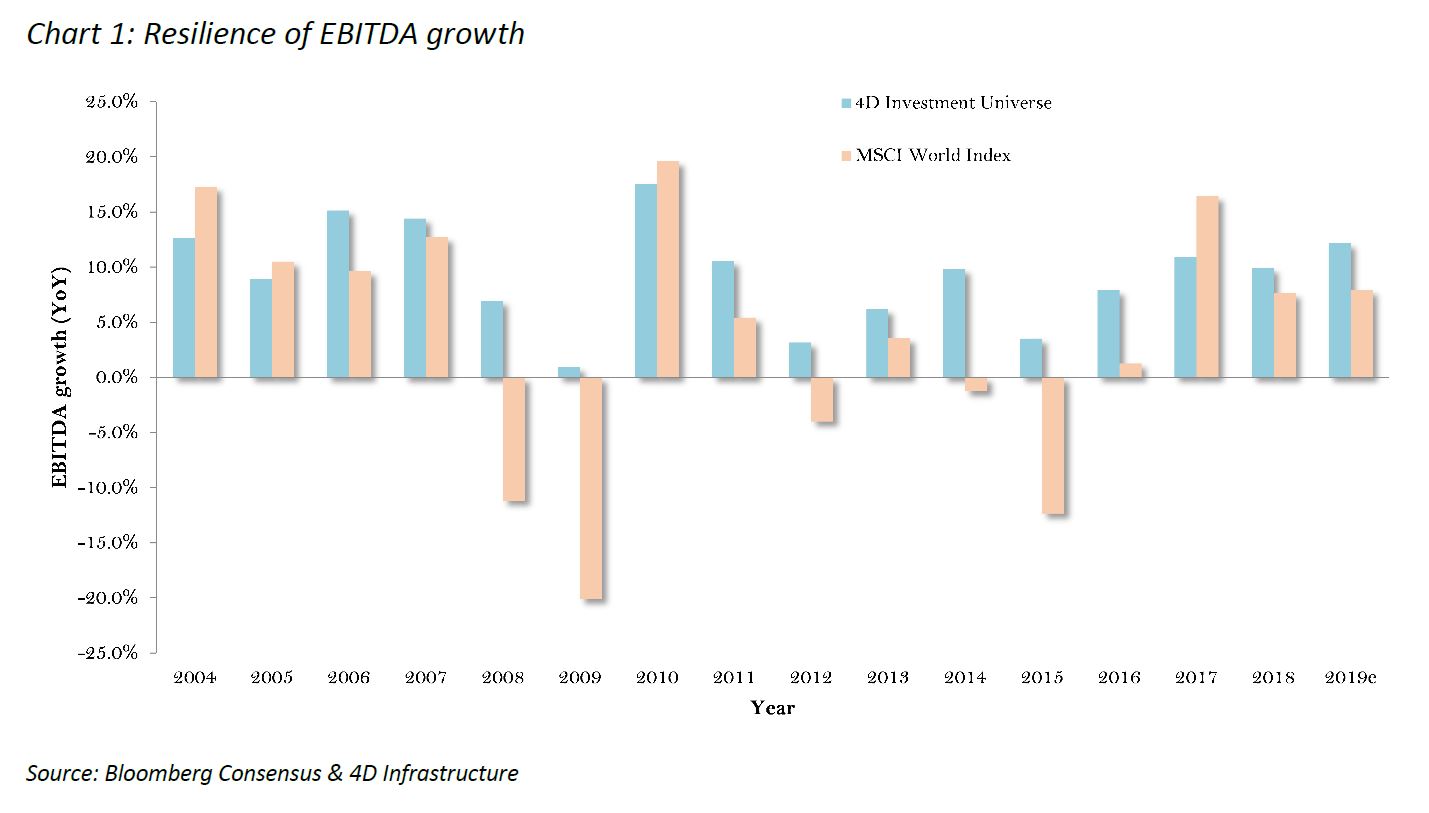
It is the combination of the above attributes that sees infrastructure labelled a ‘defensive asset class’ with generally lower volatility of earnings and higher yields than broader equities. It is these attributes that attracts investors, including ourselves, to the asset class.
History supports this earnings resilience or ‘defensiveness’, with the 4D Infrastructure universe continually reporting positive annual earnings momentum (see Chart 1). This is since 2004 (when listed infrastructure was recognised as its own asset class), so covers periods of economic boom and bust including the debt driven global financial crisis (GFC).
Two distinct subsets within the infrastructure asset class
Despite all infrastructure assets sharing many of the attractive defensive characteristics discussed above, diversity of sub-sector and region offers the opportunity to actively manage a portfolio for all points of the economic or market cycle. As noted above, infrastructure comprises two quite distinct and economically diverse asset subsets: Essential Services and User Pays.
Essential Services are the regulated utilities in the power, gas and water space. These assets are largely immune to economic shifts (up or down), as a function of them being:
- a basic need; and
- the structure of their regulatory environment, which measures returns independent of volumes.
These assets are more ‘bond proxy’ in nature, particularly over the shorter term. They are more immediately adversely impacted by rising interest rates/inflation and are slower to realise the benefits of economic growth. At the same time, they are less exposed to economic contraction and benefit from lower interest rates. These assets are an attractive overweight investment in depressed economic environments, as they can offer earnings growth and yield support even in weak growth scenarios.
In contrast, User Pay assets are positively correlated to GDP growth and wealth creation. Typical User Pay assets are airports, toll roads, rails and ports, where users pay to use the asset. These stocks capture GDP growth via volumes and often have built-in inflation protection mechanisms through their tariffs. As interest rates/inflation increase over time, this macro correlation leads to earnings upside. This should then be reflected in the relevant stock price and performance. As such, these assets are well suited to growth environments or buoyant economic climates.
Therefore, listed infrastructure portfolios can be actively managed to take advantage of the economic cycle. While a diversified portfolio with exposure to both subsets is always optimal, in tough macro environments Essential Services are the preferred overweight as the earnings of these assets generally hold up well due to them being largely immune to the macro environment. In contrast, when there is a solid, growth-oriented economic backdrop User Pays are the preferred overweight.
Further, infrastructure offers truly global exposure with assets across developed Asia, Europe and North America as well as emerging markets. This allows investors to capitalise on in-country economic cycles and gain exposure to domestic demand stories. With economic trends currently diverging, certain regions offer better relative upside at present and we can position for this.
We believe infrastructure is truly unique as an asset class in offering this portfolio positioning flexibility.
The long-term structural investment opportunity for infrastructure remains intact
Infrastructure offers defensiveness with economic diversity as discussed above. These attributes, coupled with a significant growth opportunity, create a very attractive long-term thematic for the sector which is intact despite the near-term concerns of COVID-19.
There is a huge and growing need for infrastructure investment globally as a result of decades of underspend, and the changing dynamics of the global population.
Replacement spend
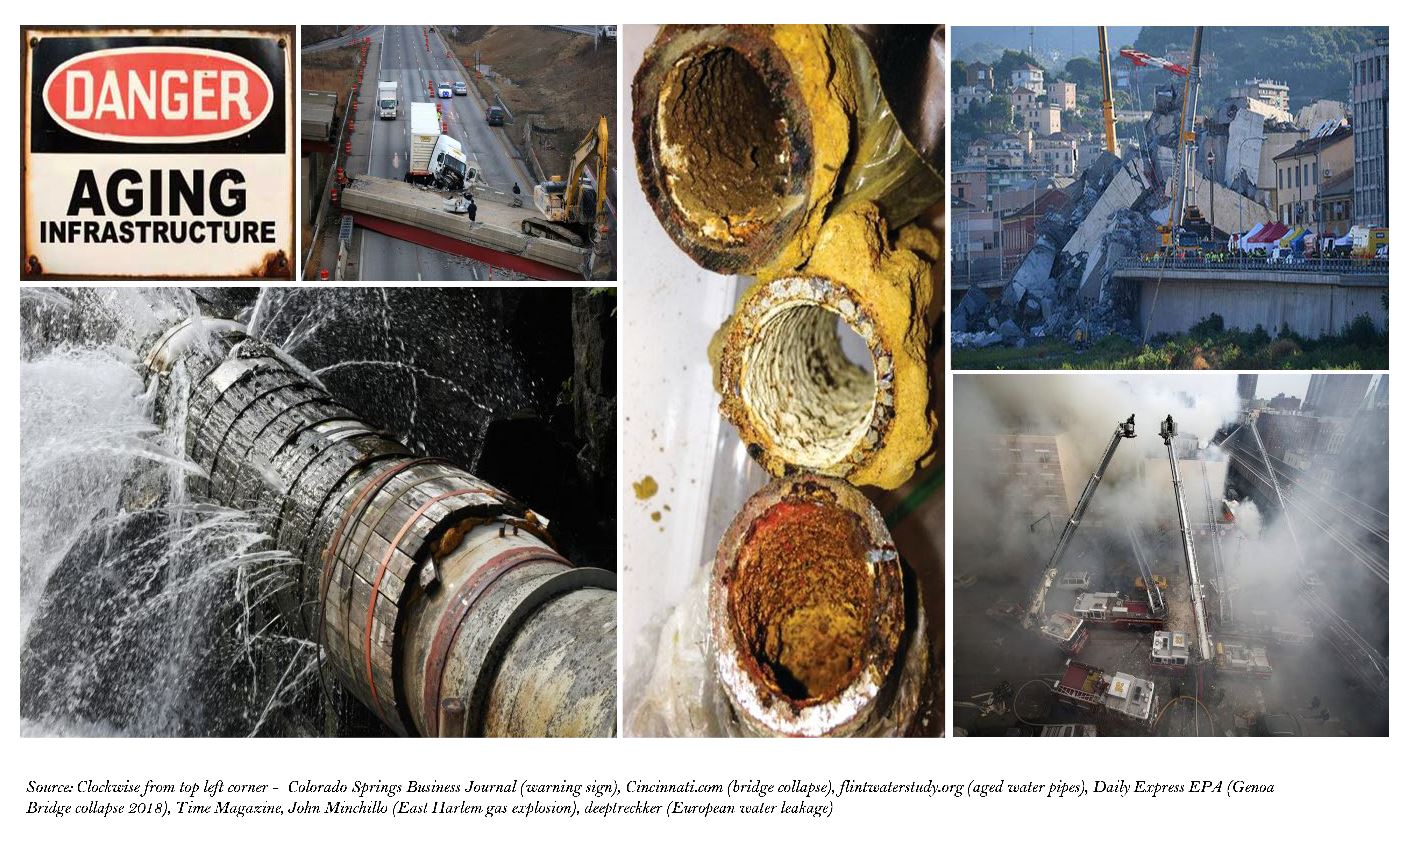
There has been a chronic underspend on critical infrastructure in virtually every nation over the past 30 years, if not longer, which was largely due to governments having other spending priorities. For example, during the GFC the priority was saving the global banking system – not replacing water mains. However, the infrastructure need is now critical. To put this in context:
- over 50% of London’s water mains are over 100 years old;
- the 2018 Genoa bridge collapse in Italy has highlighted the age of much of the European transport infrastructure – it was a ‘mere’ 51 years old. Sadly, since then a further two Italian bridges have collapsed; and
- in the United States, close to 80% of the water pipes are over 30 years old and some are over 100 years old. In some cases, wooden water pipes are still being used by the global ‘superpower’ to service their communities’ water needs.
The photos below are all examples of developed market infrastructure in dire need of investment.
Population growth & environmental considerations
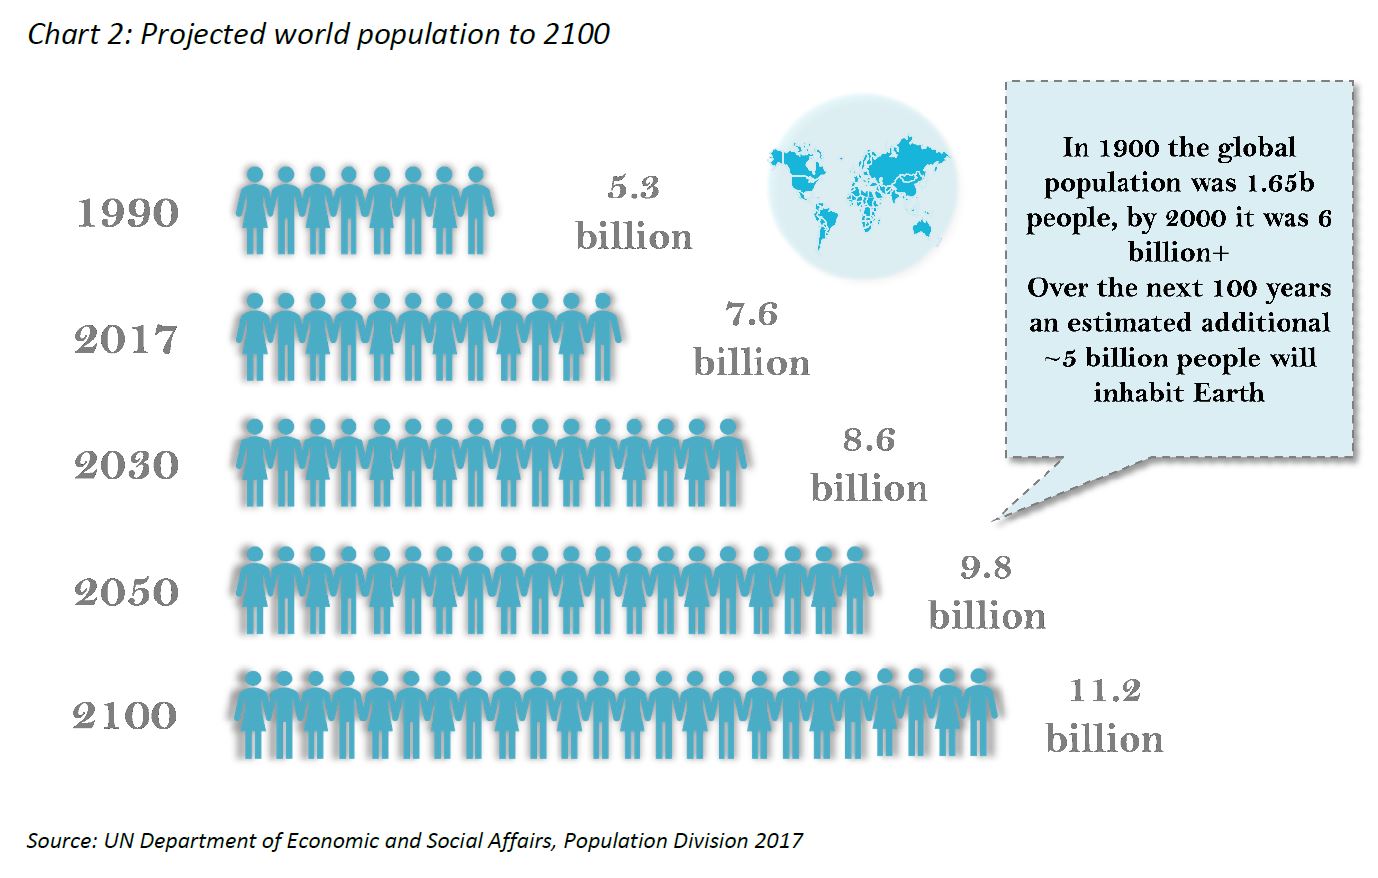
The second driver of the need for infrastructure investment is quite simply population growth. In 1900 the global population was approximately 1.65 billion people, and by 2000 that number had grown to close to 6.1 billion – keeping in mind that some of the infrastructure we are still using today was built to service that 1.65 billion. By the turn of the next century, the global population is expected to be over 11 billion, underpinning the need for yet more spend. As a society we need to first play catch-up, and then invest for the future generations.
Importantly, much of this population growth is coming from the emerging world, where demographic trends are very supportive of economic evolution and infrastructure investment as discussed below.
This population growth has also raised a number of environmental and climatic challenges that underpin the need for even more spend on infrastructure to ensure the sustainability of the planet. To that end, renewable energy and the coal-to-gas transition are thematics to which infrastructure investors can gain access.
Demographic trends support infrastructure investment
Longer-term demographic trends also further support the infrastructure asset class and the need for investment. While the COVID-19 pandemic may lead to a temporary pause in these thematics, we believe they will re-assert themselves once the crisis is behind us.
The emergence of the middle class, particularly in emerging markets (EMs), is a theme 4D finds very exciting at present, and one we believe will provide enormous opportunity for investors. Given the potential size of the middle class in EMs (China, India and Indonesia alone account for 40% of the global population), changes in spending and consumption patterns will have significant implications for global business opportunities and investment for decades to come.
From an individual’s perspective, as personal wealth increases in a country (reflected by a growing middle class) consumption patterns inevitably change. This starts with a desire for three meals a day, then moves to a demand for basic essential services such as clean water, indoor plumbing, gas for cooking/heating and power (all this requires infrastructure). With power comes the demand for a fridge or a TV, which increases the need for port capacity and logistics chains (more infrastructure). Over time this evolution progresses to include services that support efficiency and a better quality of life, such as travel – with a demand for quality roads (on which to drive that new scooter and then car) and airports (to expand horizons).
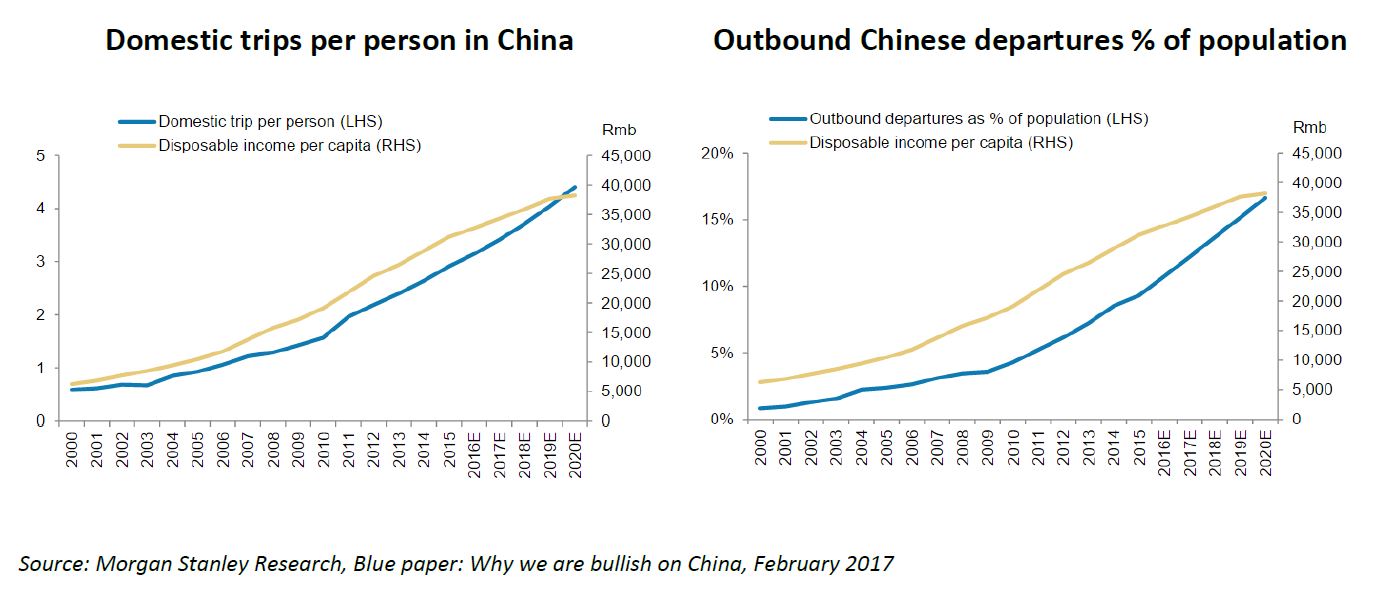
Importantly, one of the clear and early winners of the emergence of the middle class is infrastructure, which is needed to support the evolution. For example, at present only around 10% of the Chinese population has a passport (and less than 5% in India), yet pre COVID-19, airports globally were reporting record passengers driven by Chinese tourists. At the World Economic Forum in Davos last year, the CEO of Chinese travel provider Ctrip, Jane Sun, predicted the number of Chinese passport holders would grow to 240 million by 2020. At the time, about 120 million Chinese citizens, 8.7% of the population, held a passport. And in our view this is just the start. The theme will re-assert post COVID-19.?
Chart 3 shows that as disposable income has grown in China, so too has the amount of travel undertaken by Chinese residents, both domestically and overseas. While this chart is a little old, the trend has continued and post a COVID-19 blip we expect it will continue for years to come.
Chart 3: Rising disposable income/capita in China has had a positive impact on domestic trips/person and outbound departures
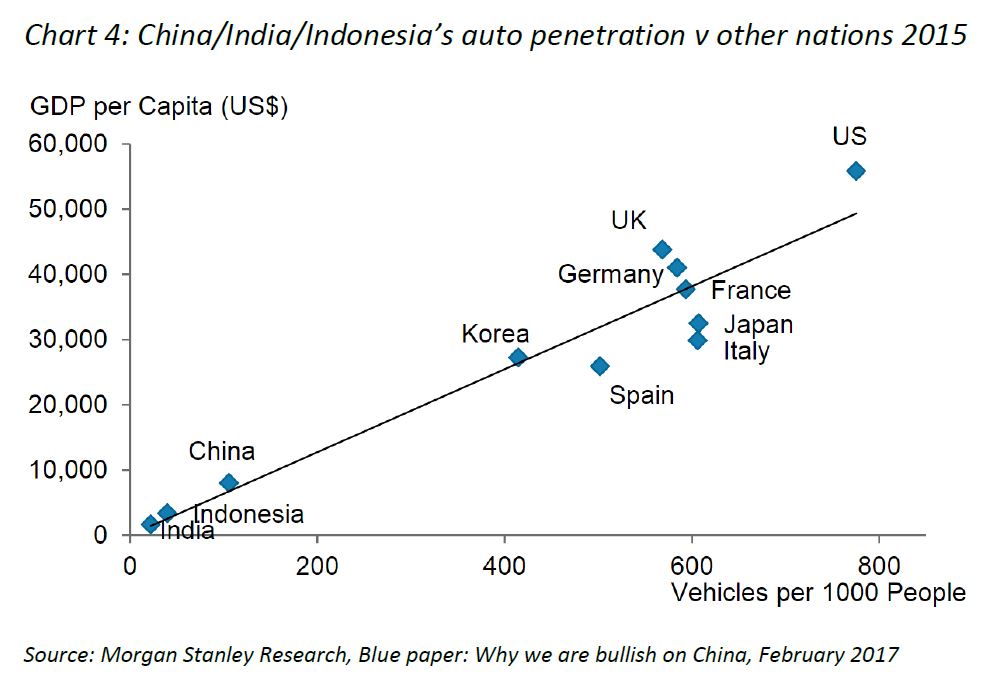
A further example of the impact of an expanding middle class is the natural correlation between growth in GDP per capita and vehicle ownership, as shown in Chart 4. China, like India and Indonesia, still has a low level of vehicle penetration. However, as each nation’s GDP per capita continues to climb, it can be expected that so too will each country’s level of vehicle ownership. Car production can therefore be expected to be strong, as will the demand for new and improved roads.
From an infrastructure investment perspective, the consequences of this changing demographic are enormous. This includes the domestic demand story within the EMs by way of utility, communication and transport investments, as well as a growing need for new and expanded international (and domestic) airports, toll roads, port infrastructure and utility services more generally.
When you put all these factors together (developed market replacement spend, population growth largely driven by the EMs, and the emergence of the middle class in EMs), the need for global infrastructure investment over the coming decades is clear. It is also clear that governments, the traditional providers of infrastructure, are simply not going to be able to fully fund this need – thereby creating a huge investment opportunity for the private sector over the coming years. That opportunity is a key thematic to which investors can gain exposure, and a thematic not derailed by COVID-19 – in fact, it is in all likelihood increased.
3. COVID-19 – the response so far
What may economic life look like ‘on the other side’?
The COVID-19 pandemic has very likely pushed the international economy into recession and cut a swathe through global equity markets. This value erosion could well continue for a while yet until it becomes clearer that health authorities around the world are getting on top of the outbreak and/or a vaccine is developed.
While the health crisis continues, increasing focus is turning to what economic life may look like on the other side. The IMF draws the analogy with a war, where there are two phases. Phase 1 is the war, where the pandemic is in full swing with mitigation measures curtailing economic activity – this lasts at least 1-2 quarters; and Phase 2 is the post-war recovery with the pandemic under control. The pace of this recovery will crucially depend on policies undertaken during the crisis. If policies ensure workers do not lose their jobs, renters and homeowners are not evicted, companies avoid bankruptcy, and business and trade networks are preserved, the recovery will occur sooner and more smoothly.
Another characterisation of Phase 2 is whether we experience a V-shaped[1] economic recovery, where the economic policies implemented in Phase 1 are effective in delivering the outcomes described above; a U-shaped economic recovery, where more pain is borne by society in the form of business closures, unemployment etc; or, worst case, a deep and prolonged recession or even depression.
Government stimulus from all corners of the globe
What we do know is the economic response to the COVID-19 pandemic from governments and central banks around the world has been massive and continues to grow. For example, to date:
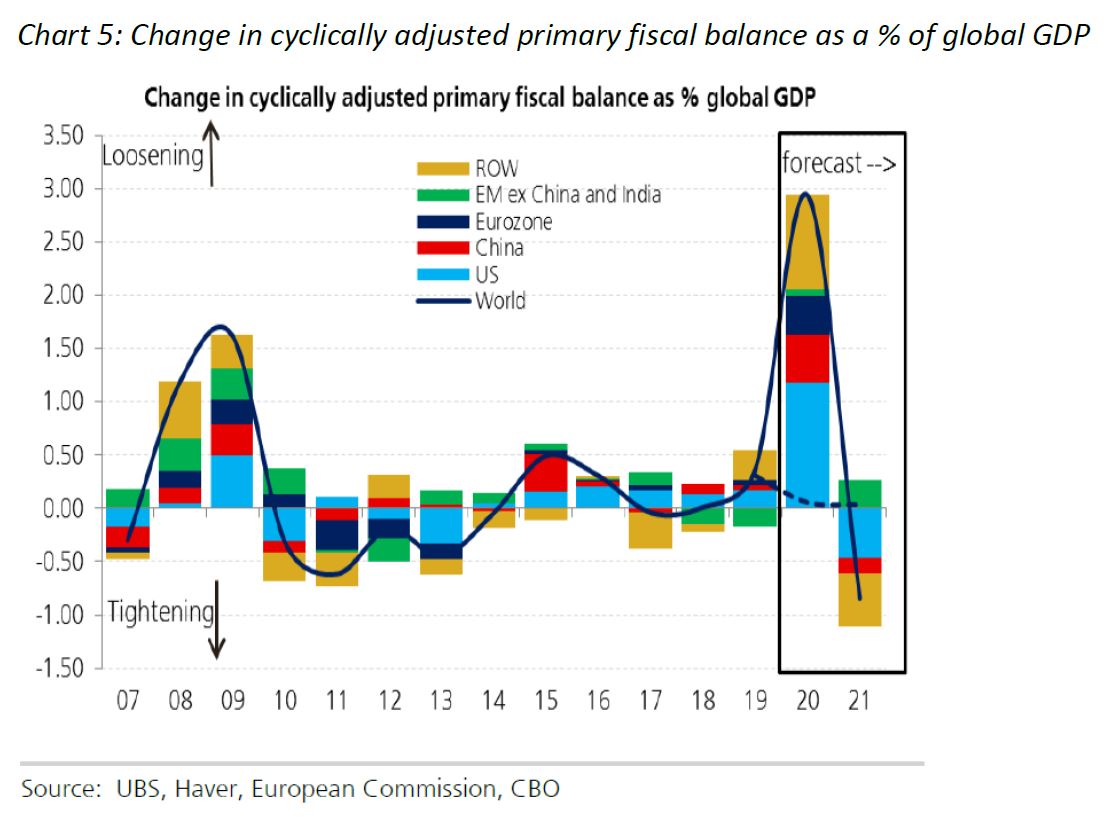
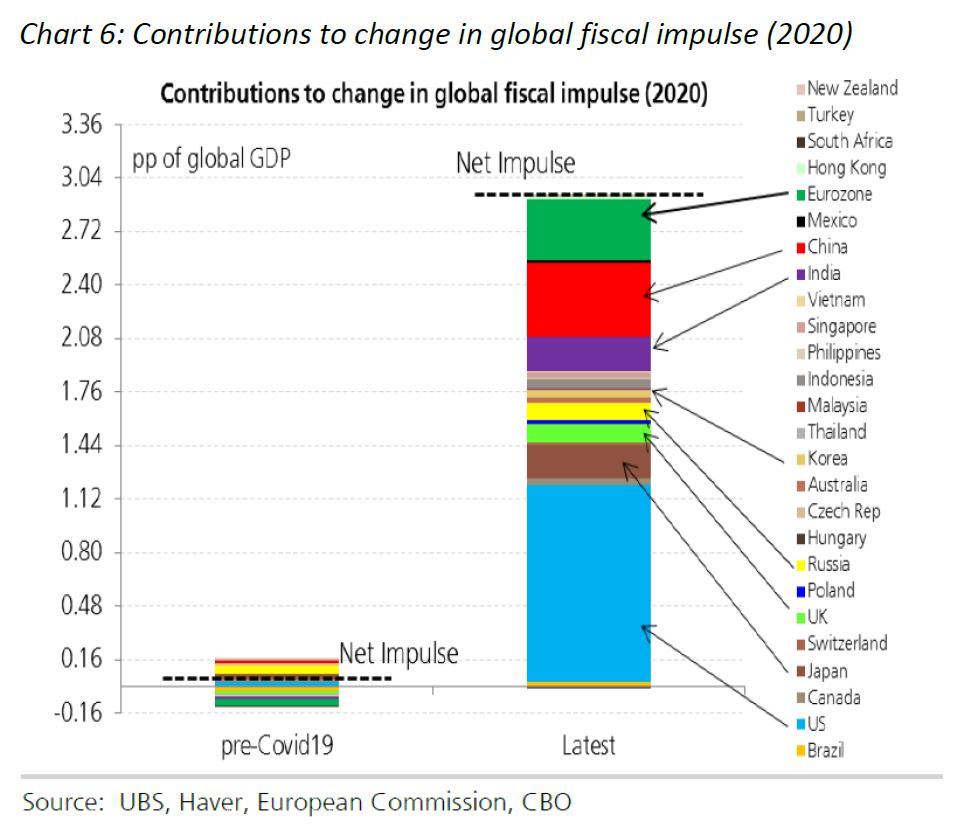
- UBS, in early April 2020, estimated the global fiscal boost in response to the COVID-19 crisis at 2.94% of global GDP, compared to 1.66% during the GFC. Additional fiscal packages are expected;
- As at 31 March, the US Senate had negotiated a nearly US$2 trillion emergency bill that aims to counter some of the economic toll of the COVID-19 pandemic;
- the US is already talking of another roughly $2 trillion package and President Trump is pushing for increased infrastructure spending as part of this new plan;
- leaders of the G20 major economies have pledged to inject US$5 trillion in fiscal spending in the global economy to blunt the impact of COVID-19 and ‘do whatever it takes to overcome the pandemic’;
- Germany has launched a program which roughly translates to ‘whatever it takes’, which suggests the lengths it is willing to go to in order to support its economy and populous;
- in Australia, the government has already launched three tranches of stimulus which, as at the end of March, represented A$320 billion in economic support, or 16.4% of GDP;
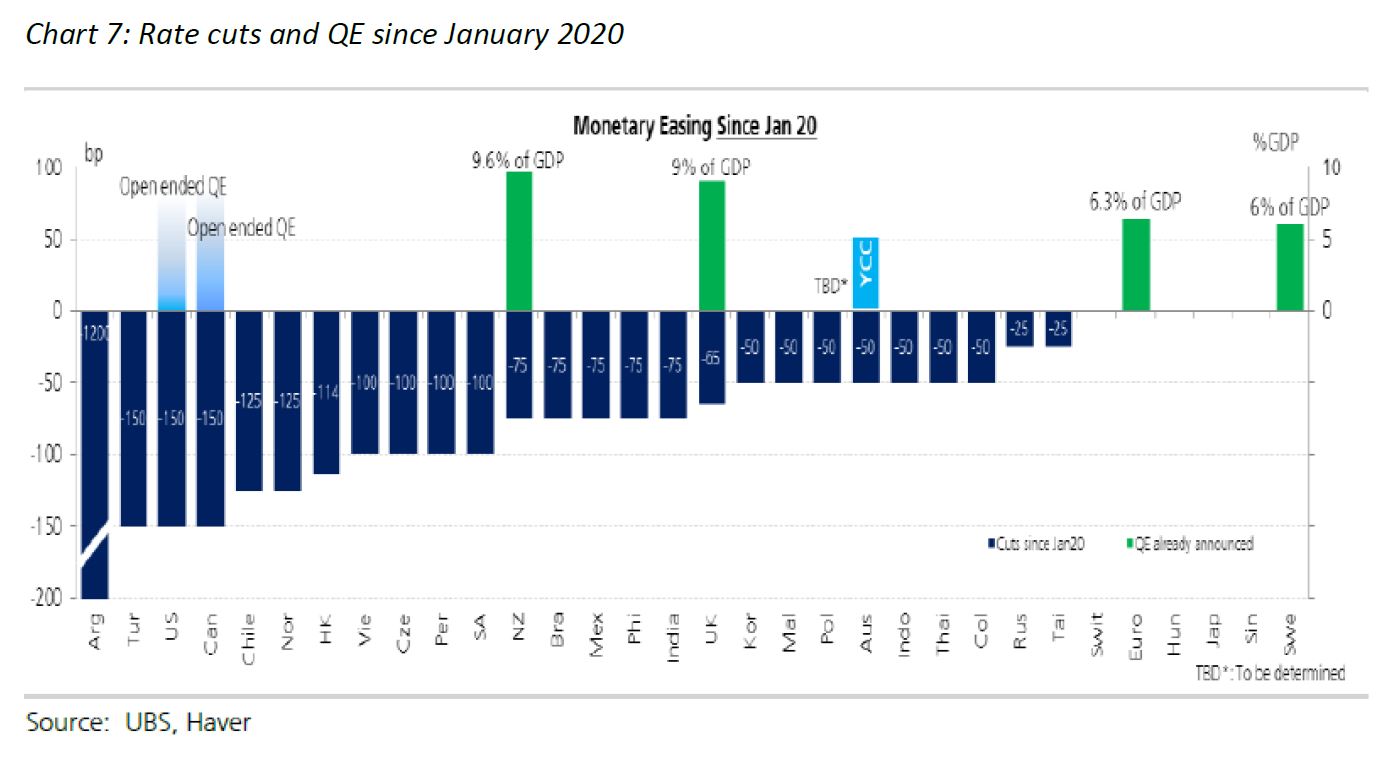
- there has been a strong global monetary response with, for example, the US Fed cutting interest rates, massively expanding its repo operations and re-initiating QE with the purchase of US$500 billion in treasury bonds and US$200 billion in mortgage backed securities; and
- faced with interest rates at zero, a number of other central banks have launched new QE programs since January 2020.
While it is too early to tell what the above combination of policies will deliver, it appears to us that, collectively, governments are targeting at least a ‘U’ and preferably a ‘V’ shaped recovery. On 6-7 April 2020, Focus Economics surveyed 77 institutions. Most see a global recession lasting two quarters, with 88% expecting a ‘U’ or ‘V’ shaped recovery, 7% expecting an ‘L’ or ‘W’ shaped recovery, and 5% ‘other’.
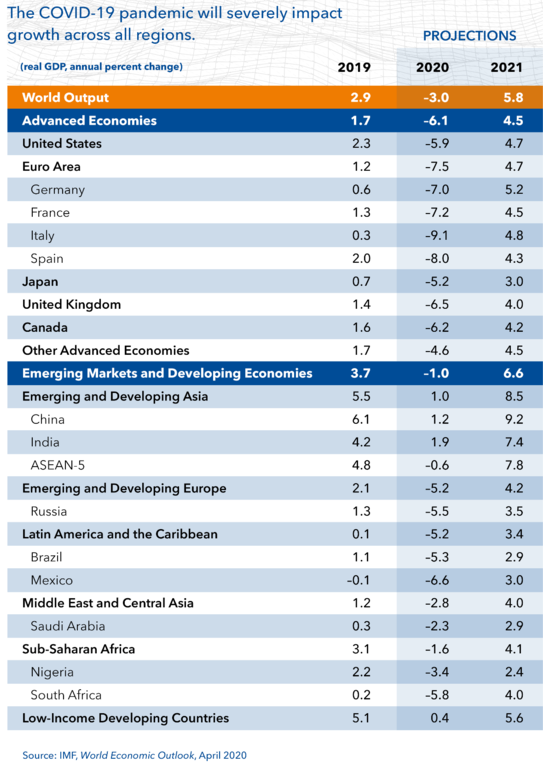
On 14 April 2020, the IMF released their updated global growth forecasts as shown in Chart 8 below. The IMF believes the ‘Great Lockdown’ recession will be the steepest in almost a century and warned the world economy’s contraction and recovery could be worse than anticipated if COVID-19 lingers or returns. In its first World Economic Outlook report since the spread of the virus and subsequent freezing of major economies, the IMF estimated that global GDP will shrink 3% this year. That would likely mark the deepest dive since the Great Depression of 1929-33. However, the IMF anticipates strong growth of 5.8% next year, but it cautioned risks are tilted to the downside. Much depends on the longevity of the pandemic, its effect on activity and related stresses in financial and commodity markets.
Chart 8: IMF Global growth projections
However, it is important to remember that once we move into the economic recovery phase, infrastructure in all its forms will be integral to that recovery and returning society to ‘situation normal’. There is no global economic recovery without roads, railways, pipelines, power transmission networks, communication infrastructure, ports and airports. Accordingly, and given the market correction we have seen to date, we believe we are indeed at the precipice of a real investment opportunity in listed infrastructure over the coming 6-12 months as the global recovery unfolds.
Lower global interest rates: supportive of valuations and infrastructure ‘bond proxies’
We have previously published several articles on our analysis of the relationship between infrastructure assets and interest rates, which we addressed briefly above and summarise as follows.
- In rising interest rate environments the traditional Essential Services assets, or Regulated Utilities, is the sub-sector within infrastructure that is most negatively impacted (at least over the short term). In many cases utility returns can be squeezed as interest rates move higher due to the regulated nature of their returns. For a Regulated Utility to recover the cost of higher inflation or interest costs, it must first go through its regulatory review process. This involves making submissions to the regulator, arguing that prevailing economic conditions have changed and that they should be entitled to recover those increased costs via increased rate charges to their client base. While a regulator is required to have regard for the changing cost environment the utility faces, the process of submission, review and approval can take some time. In addition, the whole environment surrounding costs, household rates and utility profitability can be highly politically charged. As a result, both the regulatory review process and the final outcome can at times be unpredictable.
- Further, utility stocks are often priced in the market based on the differential between their yield and the market’s risk free (Rf) rate. Therefore, in a rising interest rate environment, as the Rf rate rises so too must the Regulated Utility’s market yield in order to maintain the Rf/yield relationship that the market seeks. All other factors held constant, this is achieved by a fall in the share price of the Regulated Utility asset while its dividend payout is held constant. This is the so called ‘bond proxy’ relationship.
- In contrast, our analysis has shown that in rising interest rate environments User Pay assets tend to hold up reasonably well as they typically have built-in inflation protection in their concession deeds and are capturing the buoyant environment which has predicated the rate rise.
Of course, in the current environment we are in a period of falling interest rates or at least a period of lower for longer. Lower interest rates are supportive for all infrastructure investment. For the opposite reasons to the points we made above regarding Regulated Utilities in a rising rate environment, falling interest rates will be supportive of their earnings and share price as the gap between regulated returns and real costs widens (along with the yield dynamic).
All things equal, we also expect User Pay assets to hold up well in a low interest rate environment simply because their cost of funding and the Rf rate used by the market to value their future cashflows will both be lower which, using a traditional discounted cash flow (DCF) valuation methodology, translates into a higher stock price valuation. However, this is not an all things being equal environment, as COVID-19 will have a direct and sharp earnings impact on User Pay assets as quarantine arrangements play out. This will impact near-term earnings and create downward pressure on valuations. The lower interest rate environment will mitigate some of this valuation downside. We take a closer look at this dynamic in the appendix, but believe share prices have reacted drastically to the near-term earnings shock and we suggest have over-sold.
Are infrastructure companies feeling a liquidity squeeze?
Importantly, solid well-managed infrastructure companies are not feeling a liquidity squeeze at present, with reserves in place and balance sheets in strong starting positions (in many cases much stronger than prior to the GFC). Companies are communicating robust liquidity positions, including even the hard-hit airport sector, which should sustain them through COVID-19 into 2021 and beyond.
Prudently, some companies are cutting dividends in order to further improve available cash, as well as appease social expectations from domestic governments. However, these are not what we would call forced cuts but rather a sensible reaction to a very uncertain environment.
Management teams are also taking the opportunity of open credit markets and low interest rates to secure financing from both financial institutions and the bond markets to ensure ongoing liquidity through the COVID-19 period. Despite near-term uncertainty around economics and the duration of the pandemic, the underlying fundamentals of these assets remain attractive to debt investors which should go some way to reassuring equity investors. This is particularly true given that, during the GFC, debt markets were generally far better indicators of pending market problems than were equity markets.
There are numerous recent examples, across both utilities and user pay stocks, of successful debt raisings, including those below.
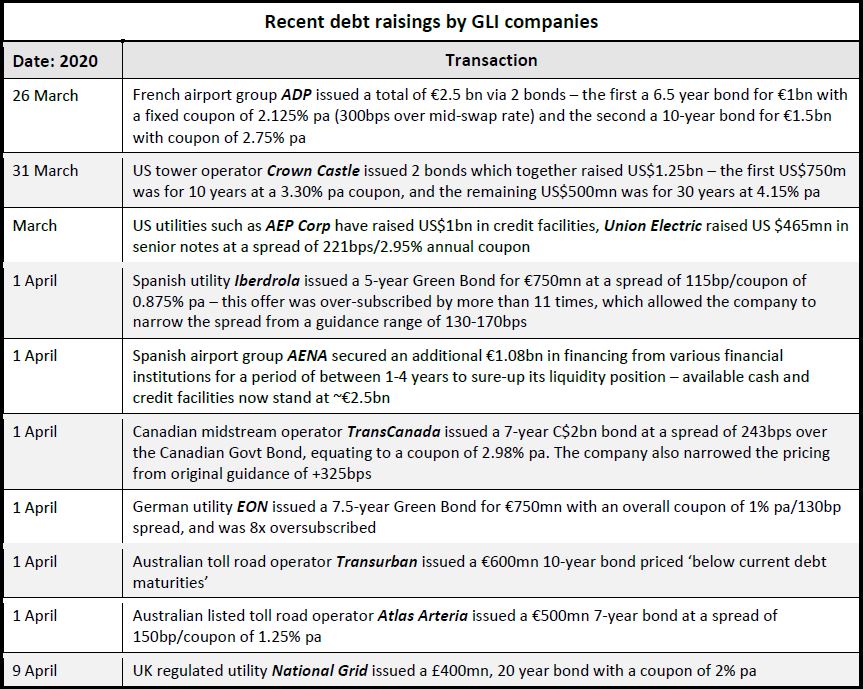
Source: 4D Infrastructure
Unlisted infrastructure revaluations versus listed equity falls – who has it right?
There has long been discussion in the market about the relative volatility of listed infrastructure assets compared to their unlisted peers. Interestingly, over short-time frames, the correlation between listed and unlisted valuations is often very low – keeping in mind that we are talking the same type of asset if not the same exact asset. However, over longer periods the correlation has proven to be higher. This is a function of listed equities being priced daily versus unlisted valuations which are adjusted less frequently (e.g. quarterly/annually), as well as some subjectivity allowed by managers/valuers of unlisted assets.
As a result of the COVID-19 global contagion, equity markets have fallen on average over 20%, with listed infrastructure down a similar amount, but with hard-hit sectors such as airports down over 35%.
Unlisted infrastructure players have also recently assessed the impact of COVID-19 and adjusted their asset valuations down, but by a much smaller percentage than the listed market falls. For example, press reports:
- Australia’s Unisuper has cut the value of its holdings in unlisted infrastructure by 6% (this investment portfolio includes the Brisbane and Adelaide airports); and
- AustralianSuper, the nation's largest super fund, has cut the value of the unlisted assets on its books by 7.5% (which includes infrastructure).
We believe the real fundamental valuation impact on these assets of the COVID-19 pandemic is more closely aligned with the unlisted valuation shift. There is clearly a significant near-term earnings impact for some of the infrastructure sectors, namely airports, toll roads and other User Pay sectors that justifies a cut to valuations. However, the fundamentals of the stocks/sector suggest the listed market has completely oversold these assets on what 4D considers to be an event-driven earnings shock. We believe this will prove to be a buying opportunity for these assets if investors can look through the near-term earnings hit.
Take an airport as an example. The grounding of flights has an immediate impact on revenues and, given airports are a high fixed-cost business, the impact to the bottom line is even greater. This impact is clearly real and warrants a correction in valuations. What should that correction be? Any investor valuing an airport on a one-year price-to-earnings (PE) multiple will be slashing their target prices as the one-year earnings outlook of the airport is dramatically cut. However, as we said at the outset, infrastructure is a very long duration asset class, with a 5-10+ years investment horizon. Accordingly, 4D (along with other infrastructure investors) values these assets using a long-term DCF methodology to determine an intrinsic fair value for the stock. While a one-year earnings (cash flow) hit will impact this valuation, for 50/60/75-year duration assets a one-year hit does not justify a 35% drop in value. Our view is premised on the fact that this is an event-driven earnings shock, not a long-term structural industry shift. We believe that while COVID-19 is causing significant disruption and earnings impacts globally, it will resolve and life will return to a new normal. We also believe the long-term structural opportunity for airports remains intact and very strong – traffic will recover and with it, earnings.
We believe this widening value disconnect between listed and unlisted valuations represents a significant opportunity for listed infrastructure investors.
4. ‘Buy’ time looming?
At 4D, we believe the combination of attractive fundamentals, long-term thematics (as discussed above), the COVID-19 response (also addressed above) and currently very attractive stock prices represent a unique buying opportunity for listed infrastructure.
Attractive entry point
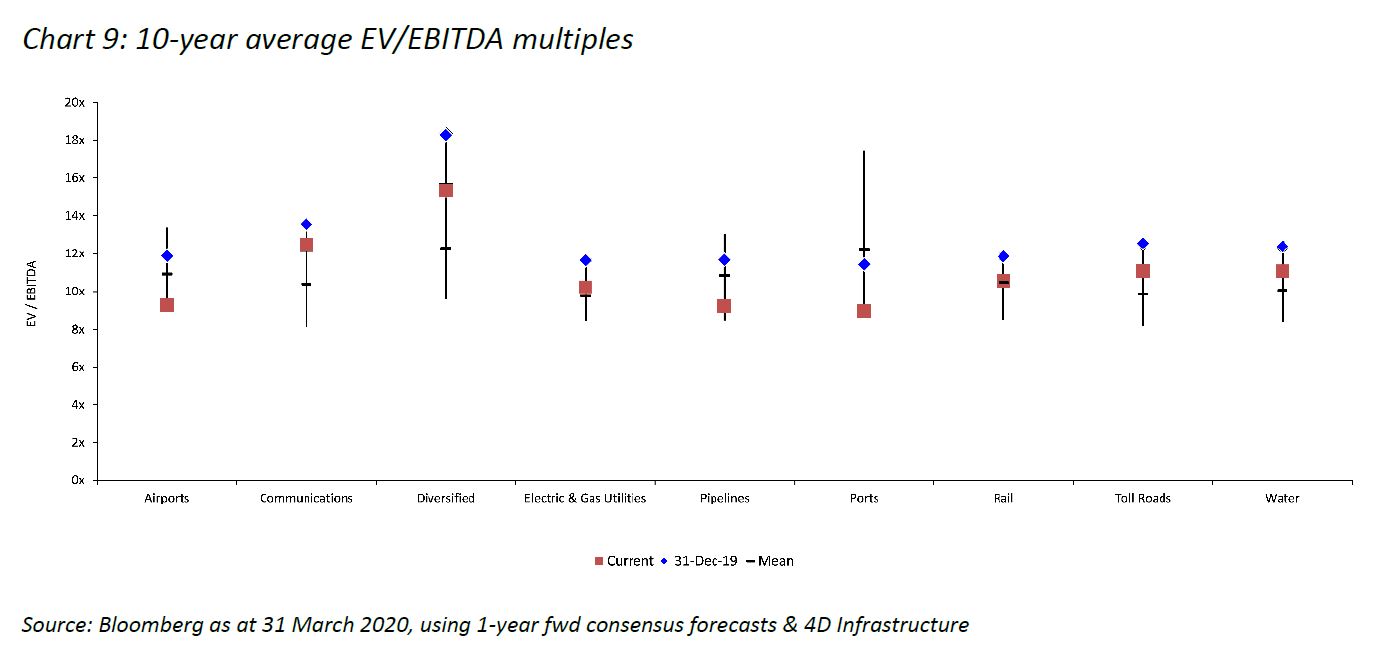
While we believe the intrinsic value of infrastructure assets is best represented by DCF modelling, it is worth highlighting that, on a multiple basis, listed infrastructure stocks are trading at the low end of their historical trading ranges. As the charts below reflect Bloomberg one-year forward consensus data, we expect further earnings revisions to forecasts for certain sectors.
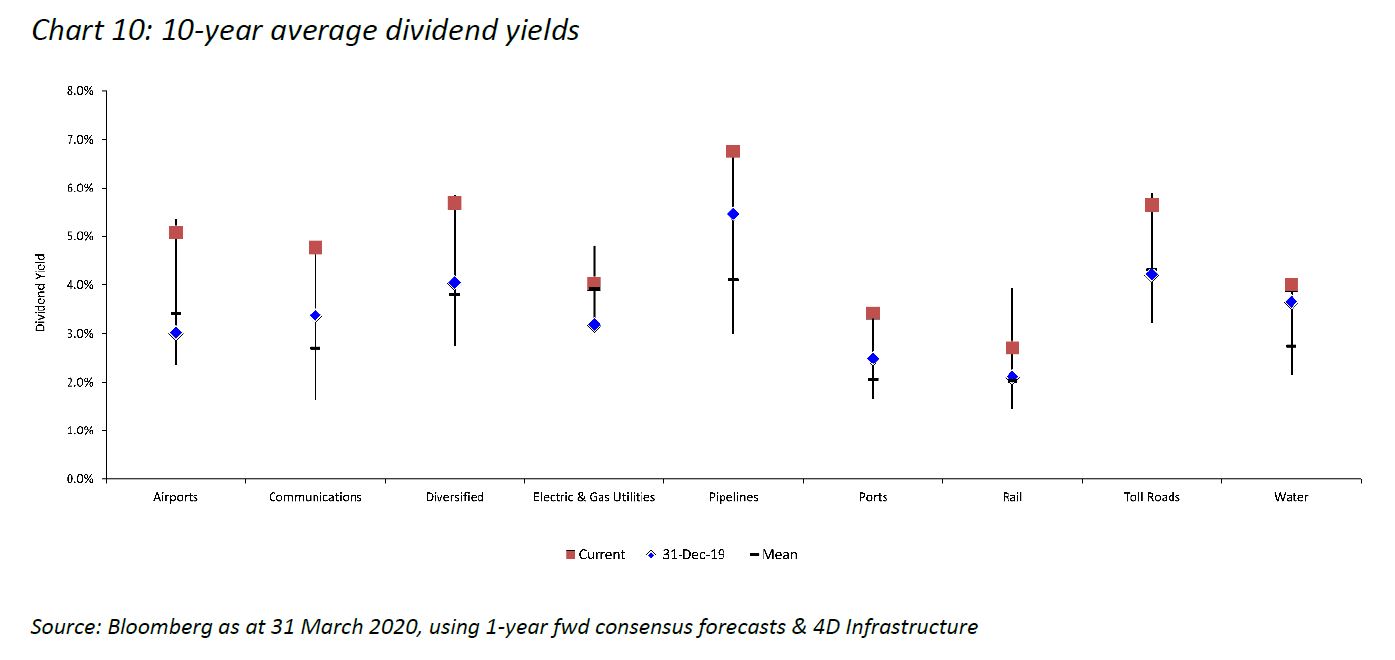
However, we do believe it highlights the attractiveness of the infrastructure universe at this point in time, which is further enhanced by the current dividend yields on offer reflected in Chart 10 below. This is particularly true when you consider where these sectors were sitting at 31 December 2019 (as depicted in the blue dots on the charts below relative to now, the red dots).
To illustrate the extent of the present investment opportunity, the 4D research team has provided a summary of the impact of COVID-19 on their coverage universe (see the appendix here) in order to demonstrate just how much recent share price movements have impacted them and where the most attractive opportunities lie.
So, to bring all the above arguments together, we believe this is a time to refrain from panic, and employ what Berkshire Hathaway’s Charlie Munger describes as ‘sit on your ass investing’, while taking advantage of any extraordinary opportunities the market might offer.
5. Conclusion
We believe the COVID-19 issue will pass, but not without obvious and significant personal and economic pain including its impact on global growth. Some of the world’s best and brightest medical research minds are focused on developing a vaccine. The reward for success is likely high in both financial and global recognition terms.
The virus has clearly caused considerable economic damage and seen equity markets fall by over 20% to the end of March. However, we believe this has created a unique investment opportunity in GLI. Once the virus is contained and/or a vaccine developed, we believe the current pandemonium surrounding daily life will ease. While we have not yet reached that point, when we do the impact of the massive global monetary and fiscal policy response will show, driving up global economic growth. Global infrastructure will be fundamental to that growth, and we expect asset values to respond accordingly. As stated at the outset, there is no global growth recovery without roads, railways, pipelines, communication infrastructure, power transmission networks, ports and airports. These assets are currently offering very attractive value to investors willing to be patient and work through the ongoing turbulence that we are likely to see for a few months yet.
To receive CPD points for reading, view this article on AdviserVoice’s website and complete the questionnaire.
[1] The letter designation (V, U, L, W) to an economic recovery refers to the speed and shape by which certain economic indicators (such as GDP growth) recover from the slowdown. A ‘V’ shaped recovery suggests a strong, ongoing bounce-back in those economic variables; a ‘U’ shaped recovery is not as rapid; ‘L’ shaped suggests a prolonged period of no recovery – potentially a depression; and a ‘W’ shaped recovery is one categorised by a recovery, then a regression back to negative/low growth, followed by another bounce then regression etc. This is sometimes referred to as a ‘double dip’ recession.