

This is the first in a series of short papers where we examine issues relating to global listed infrastructure investment. We will cover a range of topics with this paper kicking things-off with a couple of country reviews.
The concept of a country review is to analyse sovereign risk through a three-way prism - financial, economic and political risk – with the goal being to provide insight(s) to a particular country’s overall appeal as an investment destination. To facilitate comparison we will look at countries in pairs, typically those physically adjacent or closely related. Paper length constraints mean we will only be able to look at one or two factors under each risk category, but sufficient data will be presented to reach a conclusion.
We initiate our reviews with Australia and the United States. As a back-drop, we start with a brief overview of the current economic/political position in each country.
Economic and political overview
The Australian and United States economies have broadly similar key economic statistics at present, but are on quite different growth trajectories. Australia continues to struggle with the slowdown in China, and resultant subdued commodity demand. Accordingly, a key political thematic is transitioning the economy away from being so heavily commodity/export dependent to a broader, more developed, services oriented economy. As a result GDP growth is slowing and monetary policy remains accommodative, with the next RBA move likely to be down from the current cash rate of 2%. In contrast the US economy continues on a somewhat sporadic, but generally broadly based, post GFC recovery path. Monetary policy remains accommodative, but not as much as previously with the end of QE in October 2014, and the much anticipated next move in US interest rates by the Federal Reserve expected to be up from the current 0.25% cash rate.
Both countries face national elections in the second half of 2016, while the US has been more politically stable of late following leadership changes in Australia. Increased infrastructure spend is needed in both economies to help bolster GDP growth and re-stock ageing state asset portfolios.
With that brief backdrop we now examine the financial, economic and political risk of each jurisdiction.
1. Financial risk
Financial risk reflects the ability of a country to pay its way. A key metric for reviewing a country’s financial risk is its current and the recent trend in its Credit Default Swap 1 (CDS) spread. CDS came to prominence during the Global Financial Crisis (GFC) as being a somewhat better forward looking, or dynamic, indicator of sovereign risk than the traditional long-term Credit Rating.
The trend in five year CDS spreads for the two countries are illustrated in the chart below:
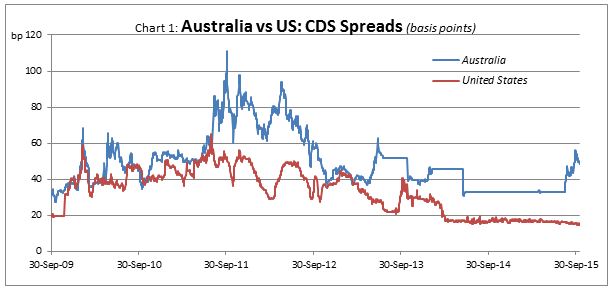
Source: Bloomberg
What is evident from the above charts is that while both spreads have more than halved over the past four or five years, the US spread is consistently well under the Australian level. Australia’s CDS spreads have ticked-up of late and are currently around 48bp, compared with the US at circa 18bp. This is despite the fact that Australia has a AAA long-term S&P credit rating, while the US was controversially downgraded to AA+ in 2011.
So what does this data suggest? Firstly, both spreads are at relatively modest absolute levels suggesting credit markets are not unduly concerned about either sovereign at present. Secondly, clearly the US$ reserve currency status, and the global importance of the US contribute to its spreads being low, and it acting as a bellwether indicator in the CDS market just like many other financial markets. Finally, and possibly most instructive, is the recent deterioration in Australia’s CDS spreads. This is possibly a reflection of recent political instability, and something we address further below.
2. Economic risk
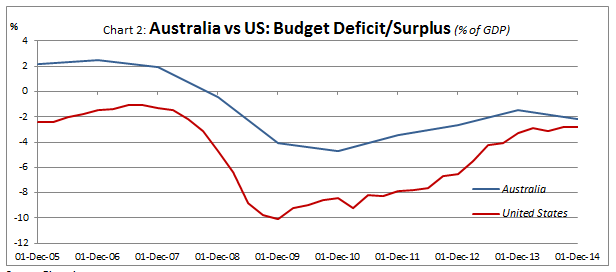
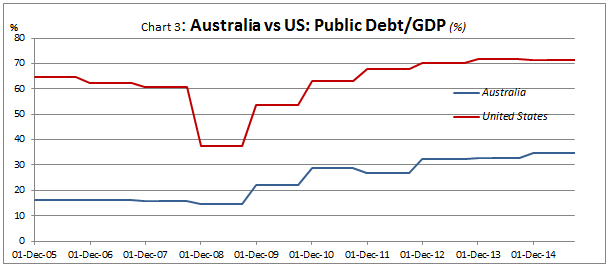
Economic risk reflects a country’s overall economic strength. As part of our methodology we look at a number of different indicators for economic risk but, for the purpose of this paper, we will examine two: budget surplus/deficit (% of GDP) and public debt (% of GDP).
Source: Bloomberg
The budget chart above indicates that the US and Australia are currently in similar fiscal positions with budget deficts of just over 2% of GDP. However, the two countries come from quite different positions with the US deficit contracting from almost 10% of GDP over the past five years, as compared with Australia which has contracted from just under 5% of GDP.
These differing budget backdrops are reflected in the public debt to GDP (%) profiles below, with the US at over 71%2 and Australia around 35%.
Source: Bloomberg
3. Political risk
Political risk reflects the overall stability of a country and is something we all develop a subjective assessment of on a daily basis by absorbing the news surrounding prevailing global events.
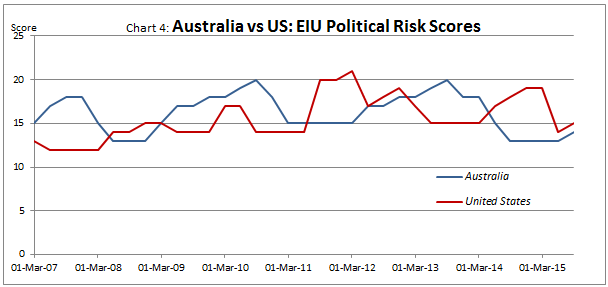
A more objective indicator of political risk is the Economist Intelligence Units (EIU) Political Risk Survey from Bloomberg. This measure evaluates a range of factors relating to political stability and effectiveness that could affect a country's ability and/or commitment to service its debt obligations and/or cause turbulence in the foreign-exchange market. The ratings are measured on a scale of 0-100; higher scores indicate a higher level of risk.
The EIU Political Risk scores for each country are shown below.
Source: Bloomberg
The very low EIU Political Risk scores of both countries (<15 out of 100) reflect the long standing, stable, working democracies the two nations represent. Rule of law, stable institutions, press freedoms and a strong, vocal middle class are common features of both societies.
Conclusions
There are a number of important observations we can draw from the above analysis.
1. Australia and the US remain attractive investment destinations
Unsurprisingly Australia and the USA remain stable, attractive investment destinations. The low EIU political risk scores reflect established, long lived, effective democracies. The CDS spreads suggest credit markets are comfortable with each nation’s sovereign risk, and that the market remains open and receptive to further debt issuance by each country.
2. Australia’s CDS spreads have deteriorated
Nevertheless the deterioration in Australia’s CDS spread is a concern and is something to continue to monitor. It is currently around 48bp, but was as low as 32bp back in August 2015. This compares with an average CDS spread for the other five AAA rated sovereigns with CDS markets of around 16bp. The spread deterioration may reflect the unstable political environment that has gripped Australia over the past few months, and the inability to deliver effective fiscal management. The deterioration could also reflect concerns regarding the economic slowdown in China and its possible impact on a large commodity exporter like Australia.
3. Both countries show improved fiscal positions
Both fiscal positions show improvement but reflect long running, somewhat structural, deficits. In the case of Australia the deficits reflect an inability to move the budget to balance, or even surplus, during a period of unprecedented mining sector wealth (and tax revenue) generation. A significant missed opportunity
4. Australia enjoys a lower level of public debt, but it is rising rapidly
The public debt/GDP positions are quite different with the US at 71% (arguably 100%+ if you include all public debt on issue). The Australian position, at 35% and climbing, reflects the strong financial legacy left by the Howard government (of $0 net public debt in 2006) combined with poor fiscal discipline since.
5. Global deflation would be unwelcome
More broadly, and more importantly, the large and growing debt positions reflect the need for policy makers to engineer some global inflation, and work very very hard to avoid deflation. Deflation not only acts as a deterrent to current expenditure (as it encourages spending tomorrow, rather than today - as everything will be cheaper tomorrow) but, as nominal GDP could be falling (or at least growing more slowly) the debt service burden, as a percentage of GDP, can become larger. Conversely, inflation helps to reduce the debt burden as the debt is mostly fixed interest, and hence nominal in nature. As GDP grows, outstanding debt as a % of GDP declines, as does the servicing obligation.
The eradication of the US debt burden post World War II stands as a textbook guide as to how inflation and economic growth can provide a sovereign debt solution. In 1946 the US Debt/GDP position was almost 110% yet within a decade, inflation and economic growth had reduced this ratio by 40%. The long post WWII US economic expansion saw the US Debt/GDP ratio fall for almost 30 years after the end of World War II, bottoming at around 25% in 1974, before commencing an increase under the Reagan administration in the 1980’s.
6. Sovereign debt levels are a global issue
Finally, the growing sovereign debt burdens exhibited by Australia and the US are not unique. A feature of the post GFC world is that, while many countries are making very credible and successful efforts to get their economies up and growing again and reducing unemployment, many retain substantial residual sovereign debt burdens. The country list is topped by Japan at a Public Debt/GDP ratio of almost 230%.
A key outcome of the GFC was that much of the private debt that caused the problem has now been effectively shifted to the public sector balance sheet via the various government bailouts. The net result is that ongoing GDP growth combined with fiscal discipline is needed to continue to whittle away at the state debt obligations. In addition, as discussed above, to assist with the public sector deleveraging process, there remains a pressing need for policy makers to engineer some global inflation, and work very very hard to avoid deflation.
In summary, the above analysis confirms that Australia and the USA remain attractive, stable investment destinations. However, movements in the CDS spreads for Australia, as well as the general level of sovereign indebtedness globally are a concern, particularly in a low inflation/potentially deflationary environment.
[1] A credit default swap (CDS) is a financial swap agreement where the seller of the CDS compensates the buyer in the event of a reference loan default (by the debtor) or other credit event. In other words, the seller of the CDS insures the buyer against a reference loan defaulting, and charges a fee or spread for doing that.
[2] 71% is US government debt held by the public which includes all debt instruments issued by the US Treasury that are owned by non-US Government entities .This number would be over 100% if you were to also include government debt owned by other US government agencies. All debt data as of 2014.