

The New Zealand ‘All Blacks’ rugby team have a long and deserved history of excellence as one of the world’s truly elite sporting franchises. Over the past decade, the New Zealand (NZ) economy has delivered an All Black-like performance despite facing some strong headwinds.
This is despite the Kiwis facing some very substantial challenges, while Australia enjoyed a huge resources boom tailwind. Below we examine some of those key economic metrics while briefly reviewing the headwinds faced by the Kiwis. Finally, as a case study in the varied approaches to common challenges, we compare the Kiwis’ approach to delivering a national broadband network with that of Australia.
1. Economics: New Zealand (6) defeats Australia (0)
As evident in the charts below, after a slow start New Zealand’s GDP growth has just about matched that of Australia over the past decade. This includes the 2011 period of the Christchurch earthquake. Significantly, in growth in GDP per capita, the Kiwis now have their noses in front, although they still trail in absolute dollar terms.

Inflation in each country remains modest and manageable, while in the key metric of unemployment NZ narrowly takes first place.

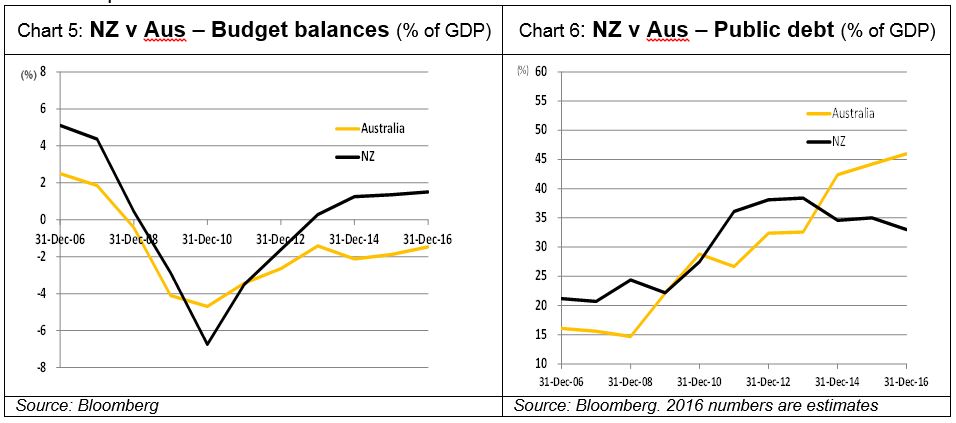
From a budget perspective, NZ has now returned to a position of sustainable fiscal surpluses (Chart 5). Realistically, this is not even on the political horizon in Australia. These outcomes are reflected in the public debt positions shown in Chart 6 below, with NZ now having a lower public debt/GDP position.
Currency movement and direction is often a good reflection of a nation’s economic performance. This is evident in Chart 7 below, with the A$ and NZ$ close to parity versus the US$. This outcome would not have been thought a remote possibility as little as three or four years ago. NZ’s relative political stability versus Australia’s is reflected in Chart 8 with a consistently lower EIU[1] risk score, although both countries have very low scores especially relative to most other countries.

2. Tailwinds and headwinds
Australia and NZ both had to confront the GFC. However, over much of the last decade, Australia has benefitted from a once-in-a-lifetime resources boom while the NZ economy has had to confront some substantial impediments to growth including:
- 2011 Christchurch earthquake
The effects of the tragic Christchurch earthquake are still being felt in the NZ economy. Full rebuild could take five to 10 years and the reconstruction cost is estimated at NZ$40 billion, or around 20% of GDP, over 80% of which is expected to be covered by insurance. While the re-build spend would also contribute to growth, it won’t supersede the damage and economic dislocation caused by the event. The recent 7.8 magnitude November 2016 earthquake in the North Canterbury region was more powerful but much deeper in the earth’s crust and in mostly rural areas. The damage bill will therefore not be as large.
- Dairy price weakness offset by increased tourism
Weak dairy prices (Chart 9) have been prevalent for some time now. This has been a significant drag on the NZ economy. In 2014 31% of NZ exports were dairy, but this had dropped to 23% by 2016. This impediment to economic growth has been partially offset by a boom in tourism (Chart 10) and net migration, which has contributed to boosting economic growth.

3. Where has this All Black like performance come from?
We believe NZ’s superior economic performance versus Australia’s over the past decade is fundamentally a product of better policy development, selection, execution and governance. The centre/right government of the now outgoing Prime Minister John Key, elected in November 2008, has been very successful at policy development and execution, as well as effective communication and being able to take the electorate with them. Their success meant they remained popular and were therefore able to govern and deliver reforms without having to deal with the stupefyingly populist, limited agenda, independent parliamentarians that have confronted successive Australian governments.
In addition to the strong economic outcomes described above, key policy successes of the Key administration include:
- tax reform: lifting the GST rate to 15% and allowing both the top income tax rate to be cut from 39% to 33% and the company tax rate to be cut from 33% to 28%. These changes have been credited with ‘turbo charging’ NZ’s economic growth. Reforms similar to this were abandoned by the Australian Government in early 2016, as they would not have been able to get them through the Senate;
- electricity asset privatisations: implementing a policy taken to the 2011 NZ election, the Kiwi Government overcame a referendum rebuke to partially privatise the electricity system with the proceeds re-invested in new infrastructure assets. This policy has been largely adopted by the Baird Liberal Government in NSW; and
- reform of the welfare state: involving the adoption of an actuarial approach to determining the cost of welfare allowing targeted intervention.
4. National broadband networks: a case study in the different approaches to public policy implementation in NZ versus Australia
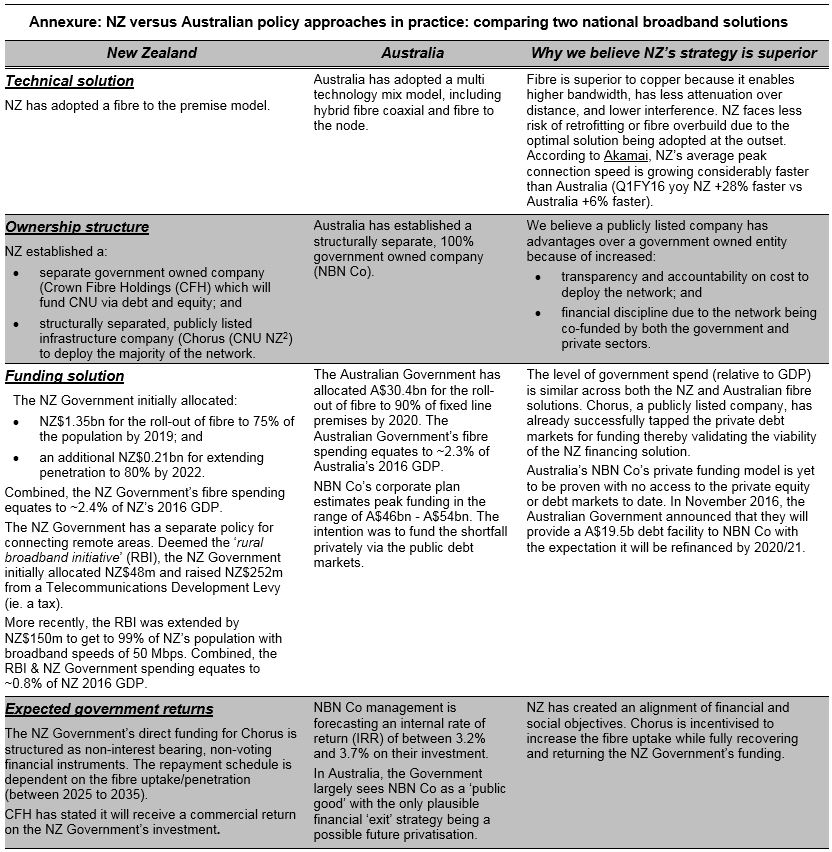
The differing philosophical approaches to delivering public policy between Australia and New Zealand is clearly evident in the alternate ways each country has sought to deliver a national broadband solution. While the vast differences in the respective country’s land masses would have been an important factor in the varied policy choices, the differing philosophical approaches are quite stark. We compare the two strategies in some detail in the Annexure below.
Key points of difference include:
- technical solution: NZ has adopted a ‘fibre to the premises’ model whereas Australia is adopting a hybrid approach. Fibre to the premises is technically a superior solution;
- ownership structure and funding solution: Australia’s NBN business is wholly government owned and funded. In contrast NZ has immediately imposed private market disciplines on its NBN via structuring its funding through a publicly listed communications infrastructure company (Chorus Limited (CNU NZ)) with access to debt and equity markets;
- exit plan: the only plausible exit for Australia from NBN Co is via a privatisation at some uncertain point in the future, subject to the performance of NBN Co and the political/economic climate of the time. In contrast the NZ Government’s equity and contributions are structured to be repaid out of the operating cashflows of the Chorus business, depending on how successful it is with the rollout and take-up.
It is the NZ philosophy of, from the outset, imposing private market disciplines, objectives and targets on the rollout of the broadband solution which, we believe, is superior to the traditional government funded solution adopted in Oz. We believe the NZ approach will lead to more disciplined control of costs and capital expenditure, ultimately improve the chances of the business surviving and succeeding, and NZ taxpayers seeing their hard earned tax revenues that were invested in the broadband business returned at a profit to government coffers.
Essentially, the Kiwis look at the broadband project as a national investment with expected financial returns, whereas the Australian Government largely treats NBN Co’s funding as a ‘grant’.
Conclusion
The NZ economy has delivered a decidedly better outcome than its cross ditch cousin over the past decade despite facing substantial economic headwinds. We believe this has been the case because of stronger, more focussed governance and better policy development and implementation in NZ. This is well illustrated in the two countries’ alternate approach to a national broadband solution. Much can be garnered in Australia from the Kiwi approach and experience.
1] The Economist Intelligence Unit (EIU) is a division of the British Magazine The Economist. It provides economic forecasting and country risk ratings.
[2]: 4D Infrastructure is a shareholder in CNU NZ