

Two quotes from our paper stand out:
“Considering the many parts of Trump’s agenda, a number of conflicting dynamics mean there is a wide range of distribution of risks around outcomes, with what we believe a fatter tail risk to the downside.”
“We remain conscious of the uncertainty of Trump’s administration as he is set to take office – but are mindful that predicting his every move is a fool’s game.”
The first half of 2025 witnessed wild rides across equities, bonds, currencies and key commodities – the fatter tail risk played out to the downside, as did Trump’s unpredictable ways and flip flopping of policy direction.
While markets ended up higher for the half, the direction of travel was a roller coaster:
- Trump’s unexpectedly harsh ‘Liberation Day’ tariffs took equities into bear market territory from their February highs, later rallying to new highs as countries were given a 90 day pause to negotiate trade deals – igniting the TACO trade (“Trump Always Chickens Out”).
- Trump got his One Big Beautiful Bill Act (OBBBA) passed, fuelling concerns over an already bloated US fiscal position – pressuring long term bonds and causing an increase in the term premium. Noting however, that concessions were made including the removal of the very contentious Section 899.
- Geopolitically, Trump took unprecedented action in the Middle East by directly bombing Iranian nuclear facilities - ending the ‘Twelve Day War’ and reversing the 15% spike in oil prices triggered by the risks to supply in the Straits of Hormuz.
- The US continued a protectionist and isolationist agenda, fuelling a restructuring of the geopolitical order and in defiance sparking unity amongst Europeans to boost defence spending, and with it, a very large fiscal stimulus to a waning economy.
- In combination, Trumps actions have raised questions around the dominance of the USD, and we saw a large depreciation of around 10% - with Europe a large beneficiary of global capital flows.
What happened so far in 2025?
We review below the main parts of our 2025 outlook that were confirmed in the first half, and their impact (positive, negative or neutral), as well as the several surprises.
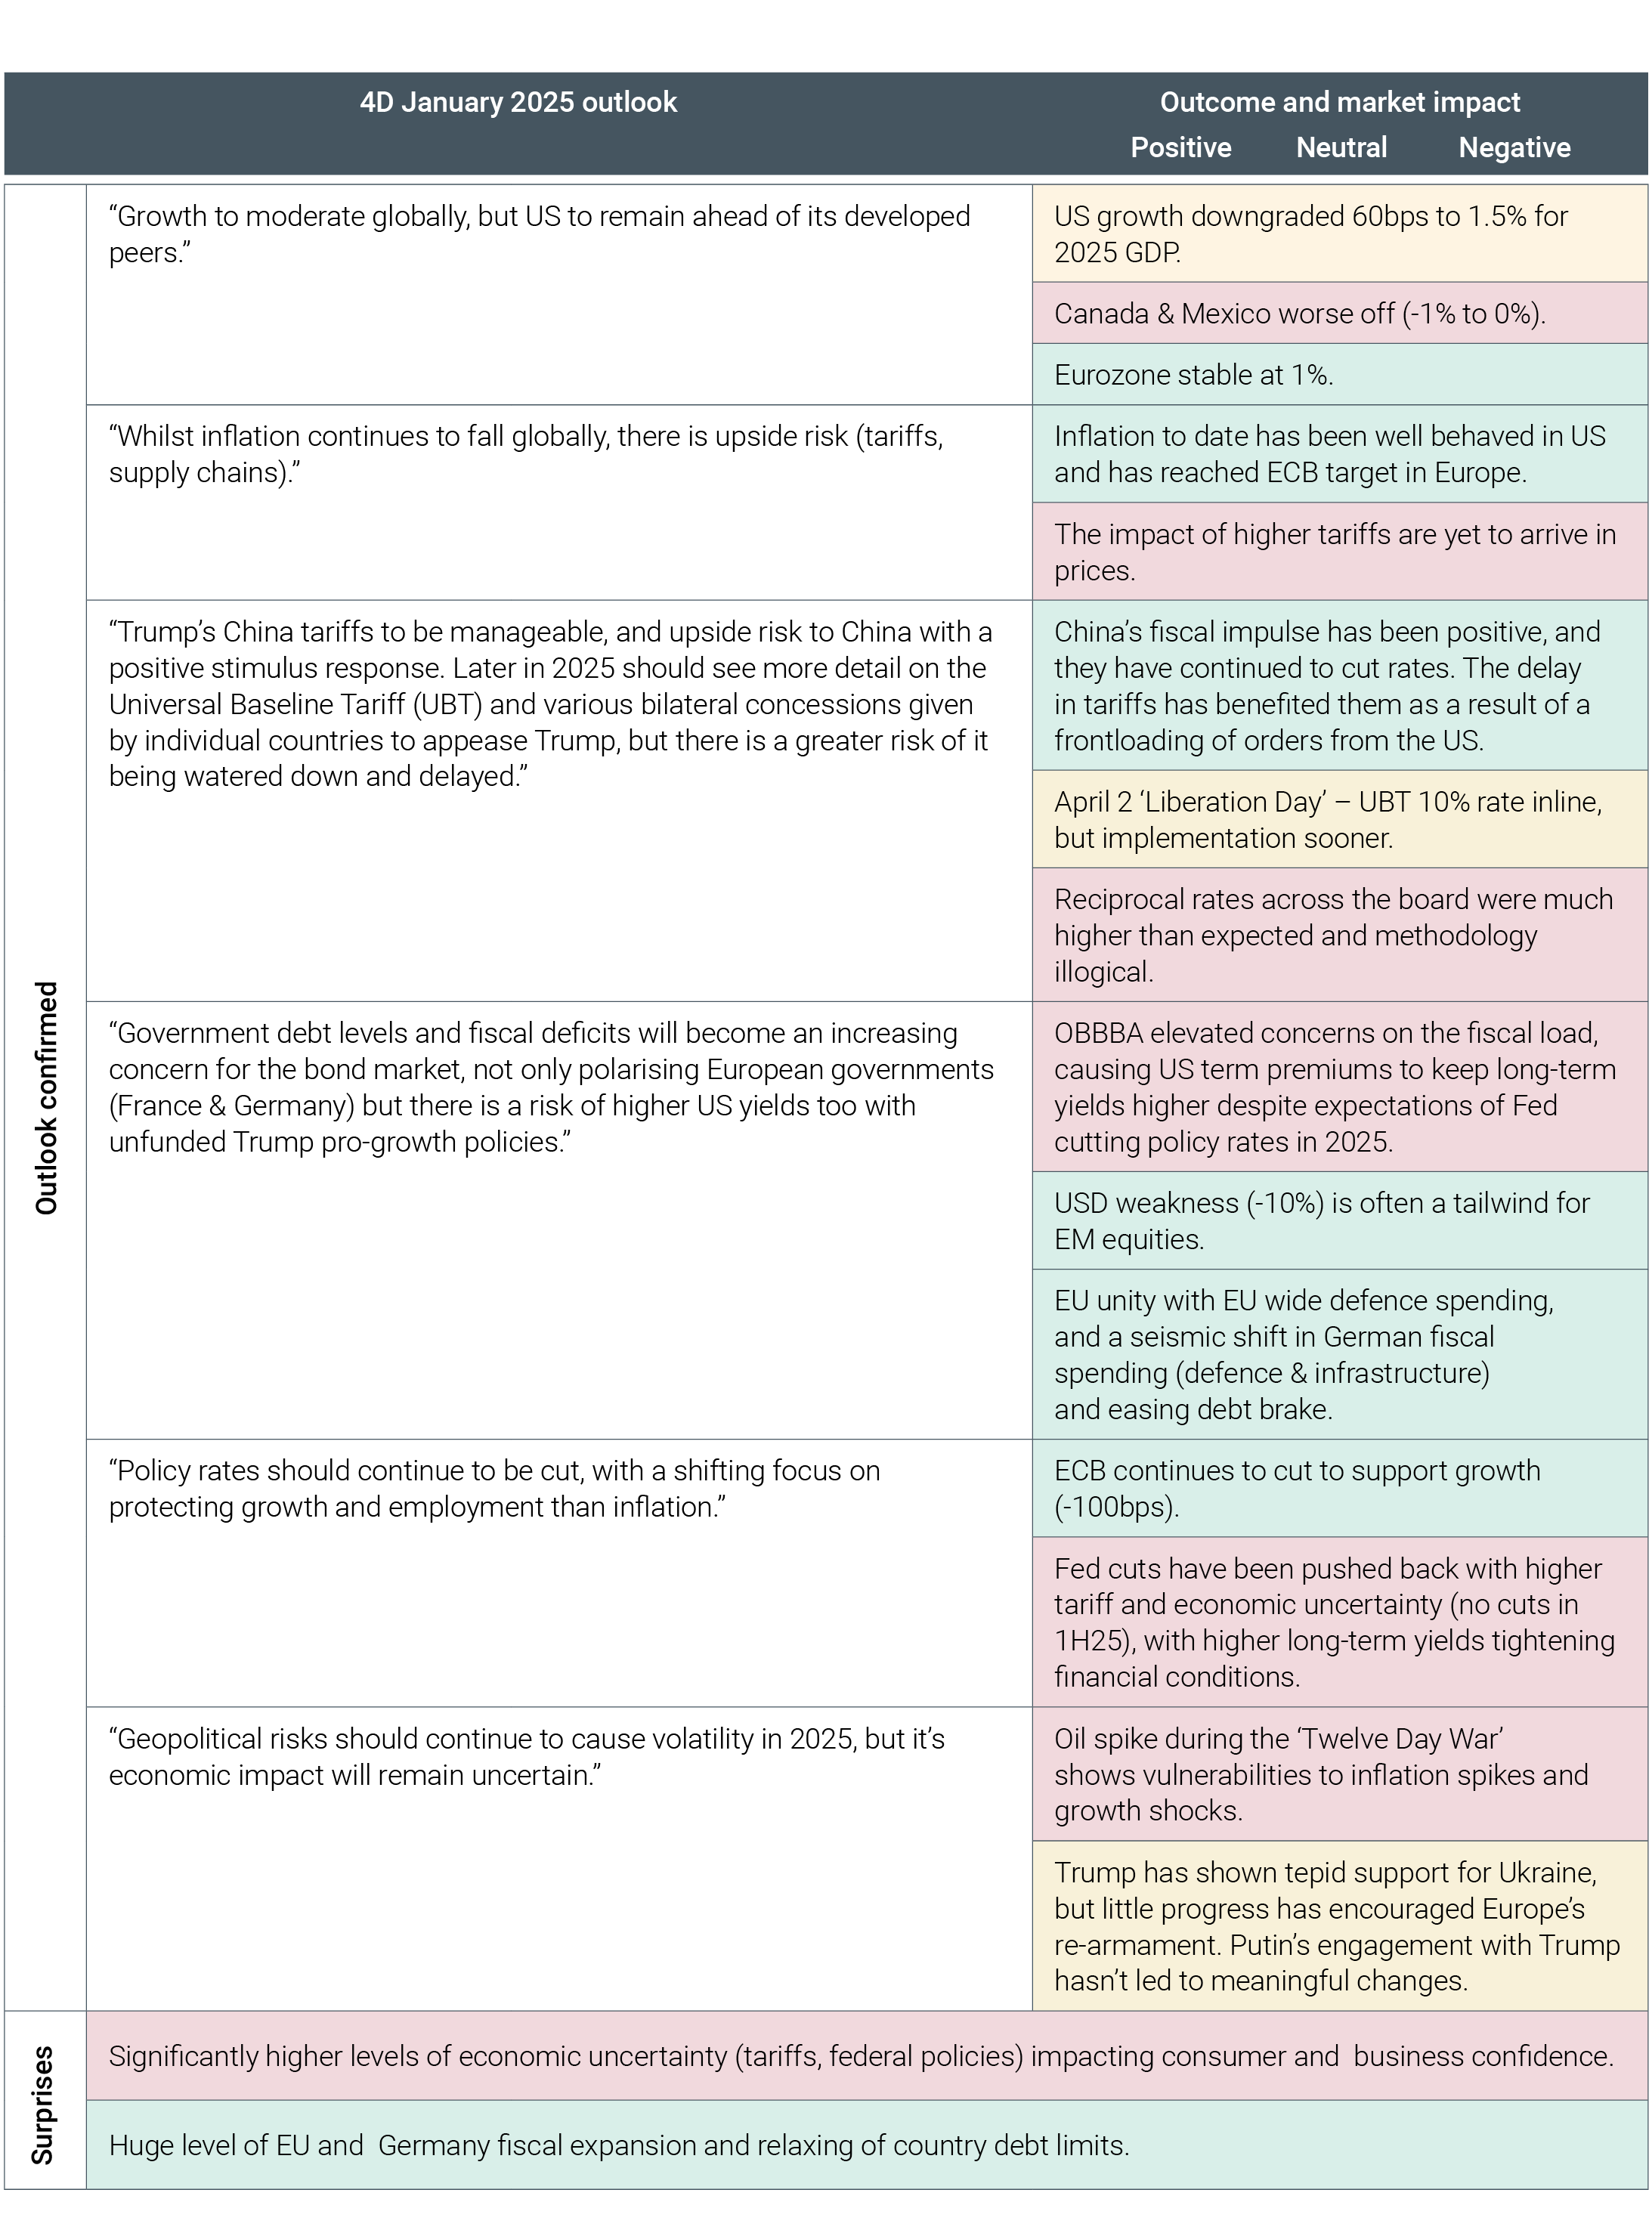
We expand on a few of these developments with our favourite charts.
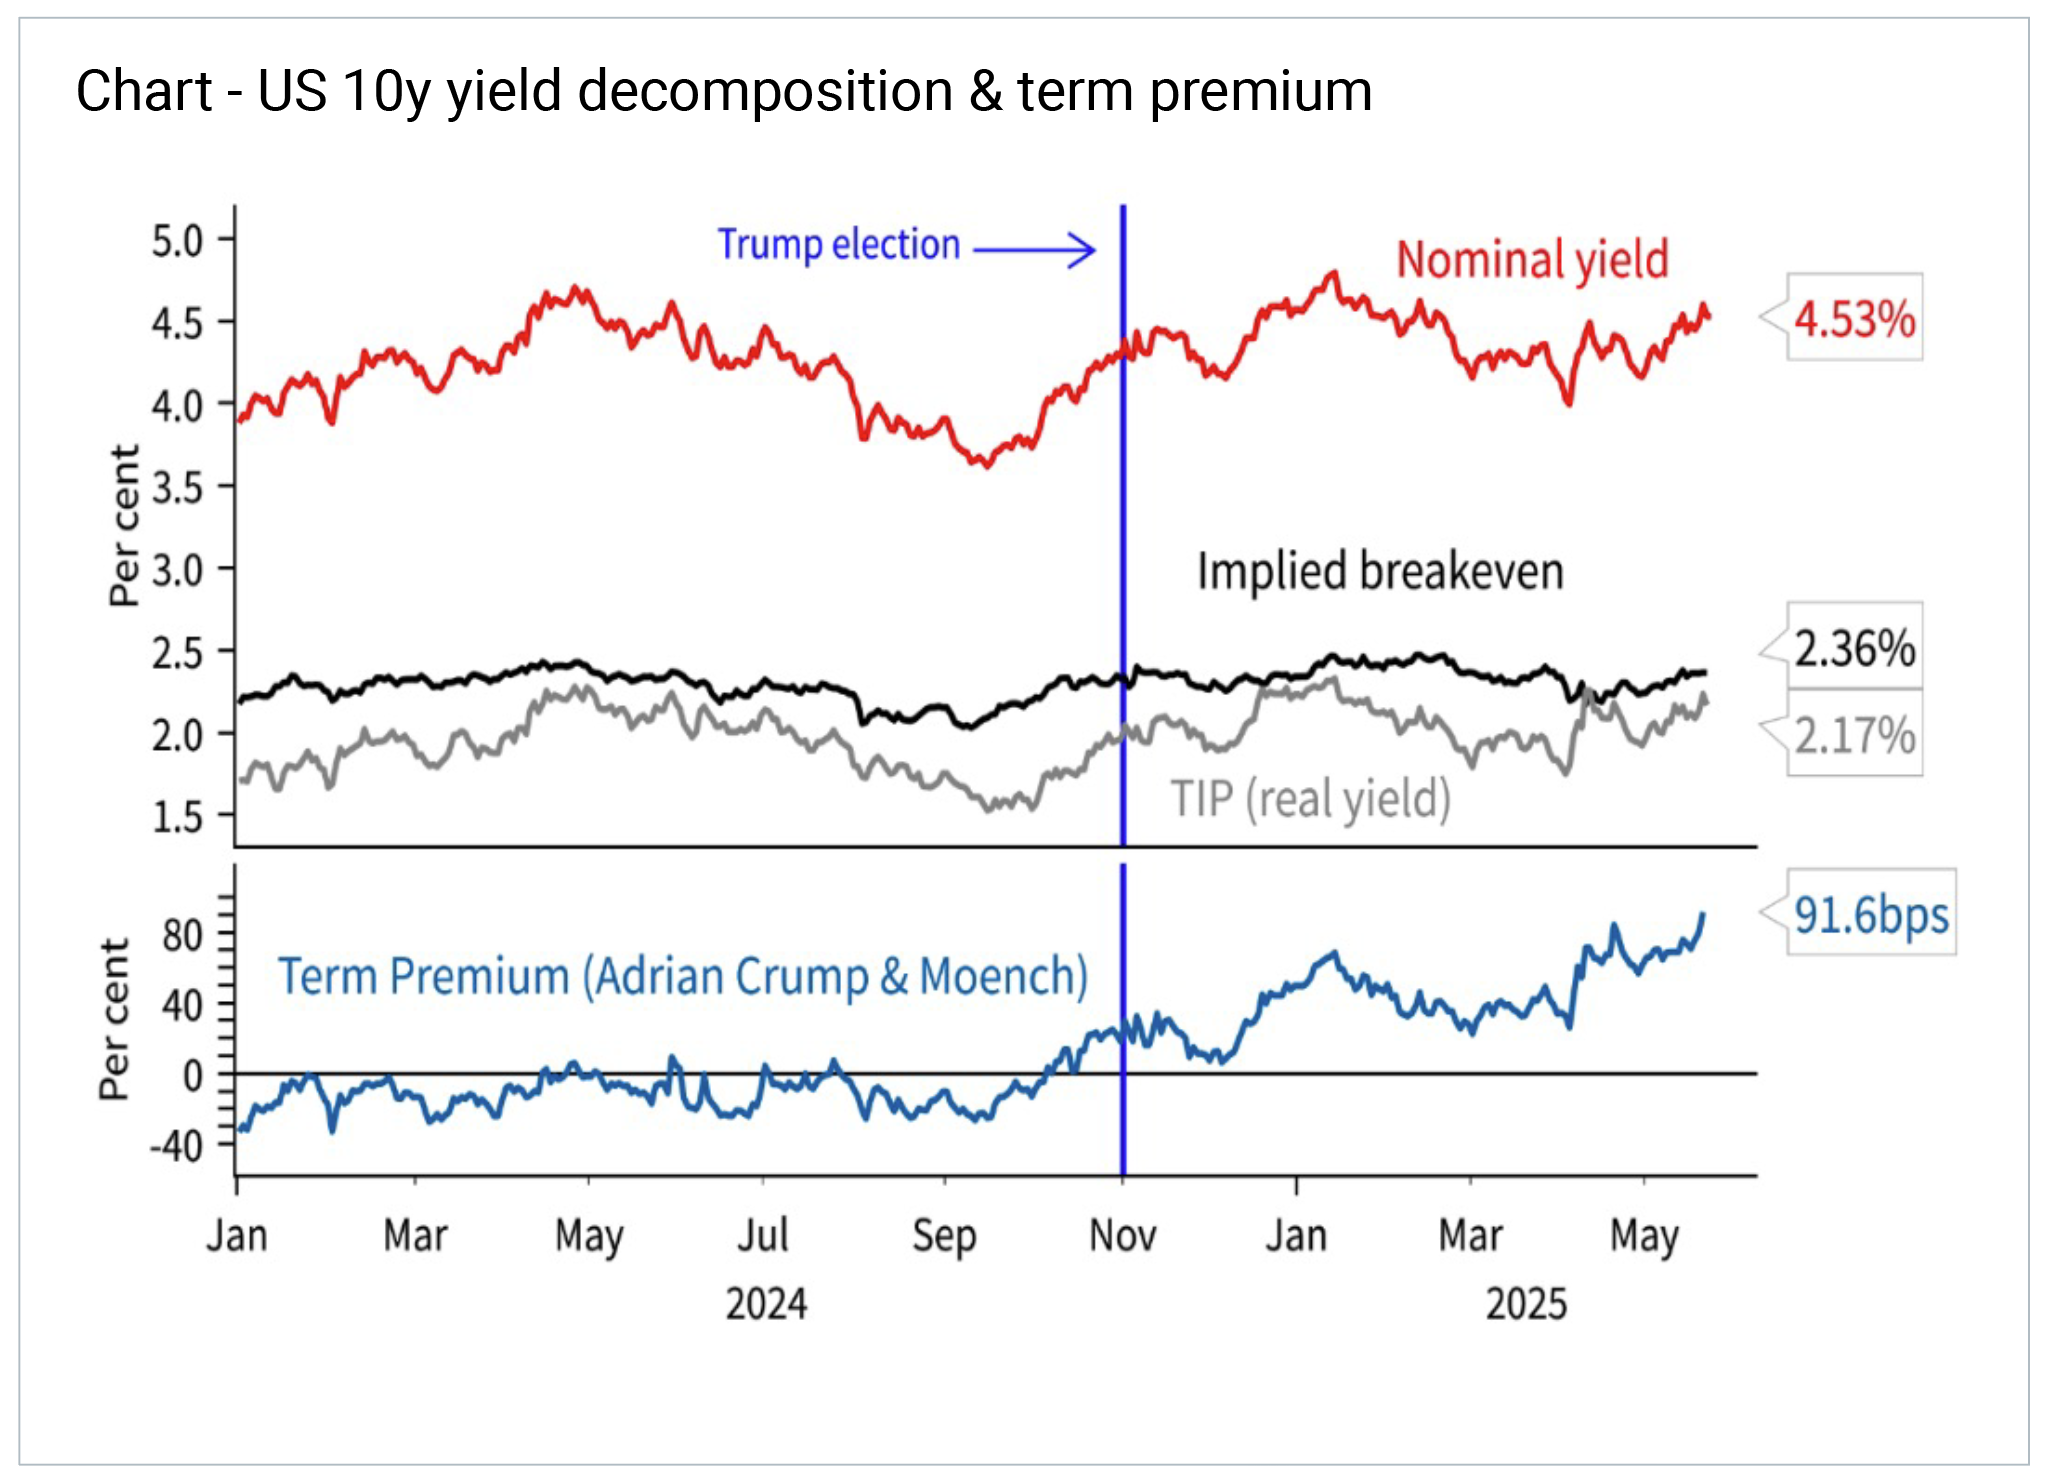
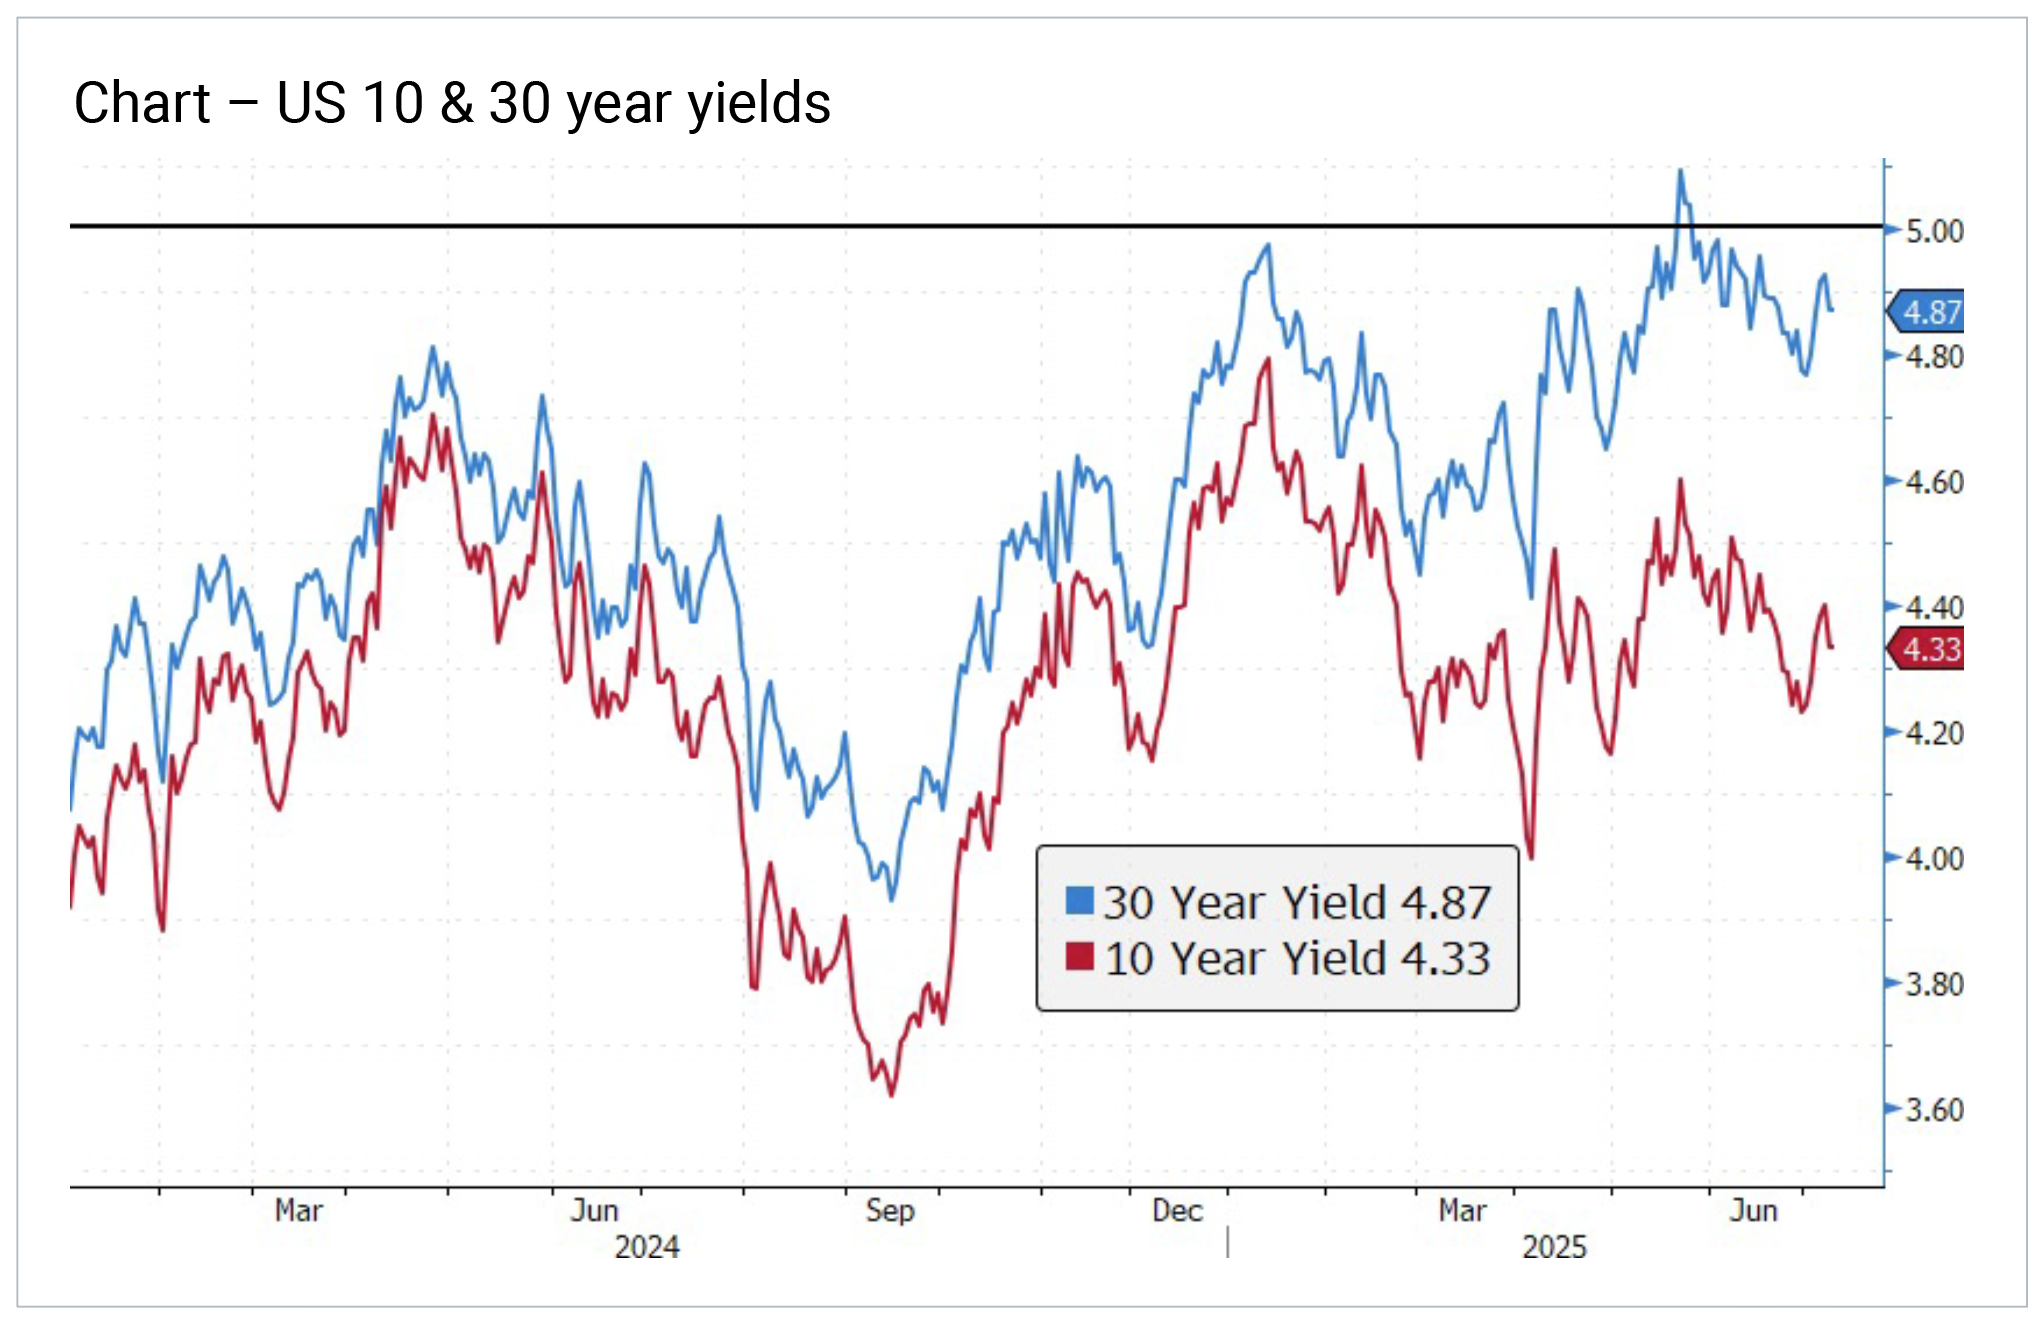
Theme 1 – Term premiums & higher yields
The market is pushing long term yields higher through higher term premiums – tariffs raise the risk of inflation, and OBBBA is adding to higher deficits and a growing debt burden.
 Source – NAB
This also reduces the need for the Fed to cut rates as financial conditions are tightened and uncertainty increases. Despite 100bps of Fed cuts since September, long bonds are higher.
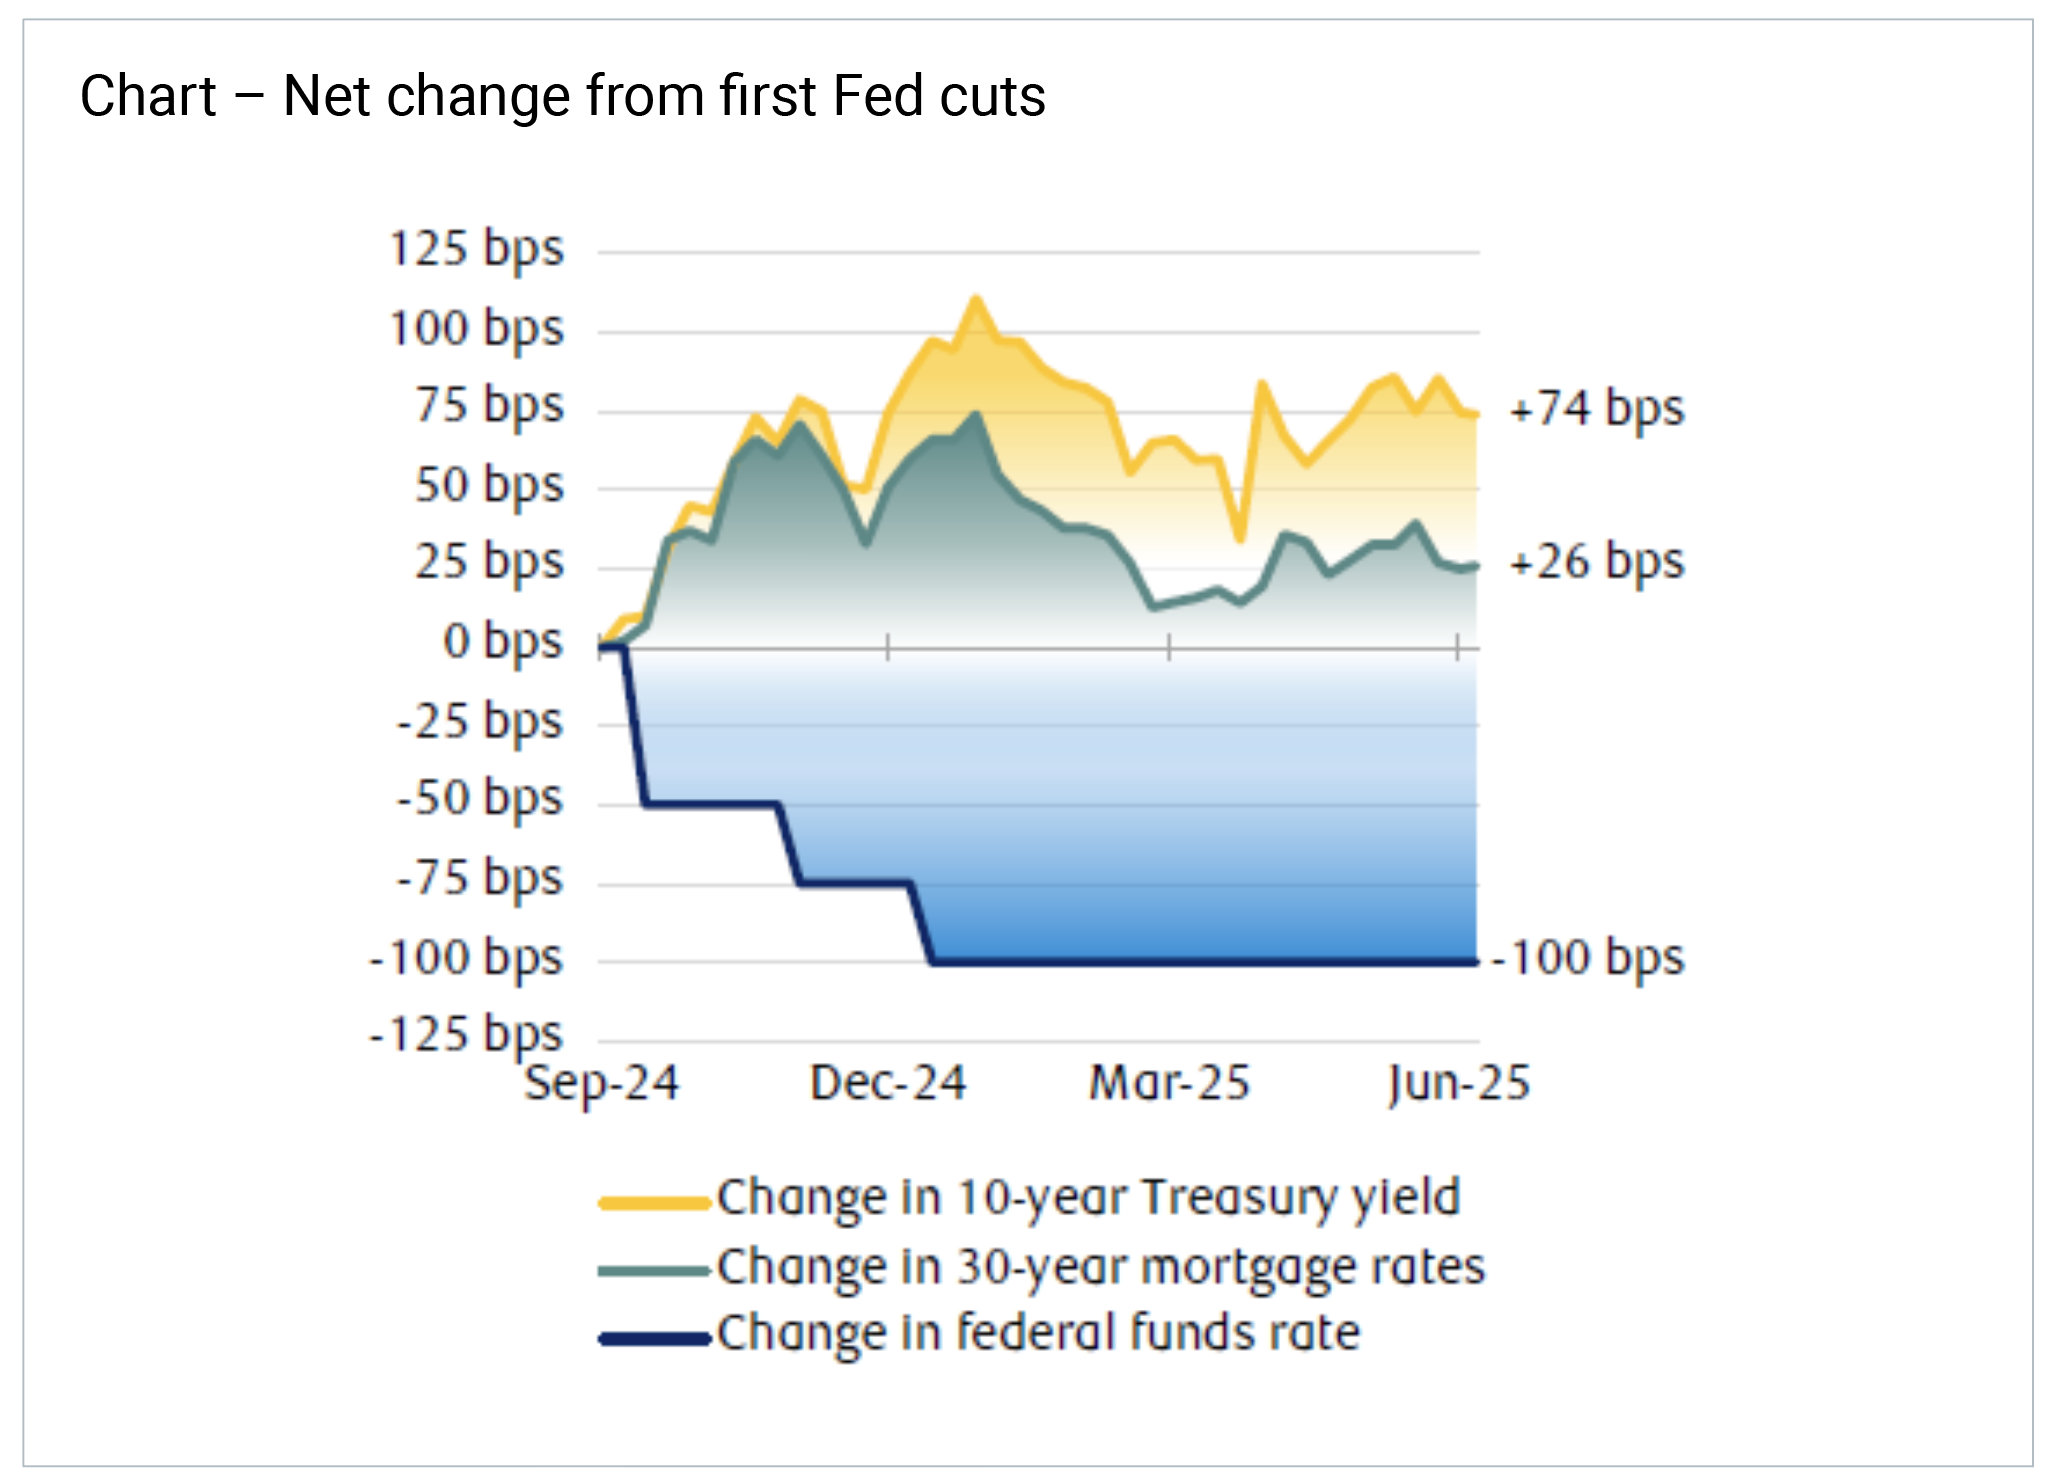 Source – RBC, net change from 13/9/24
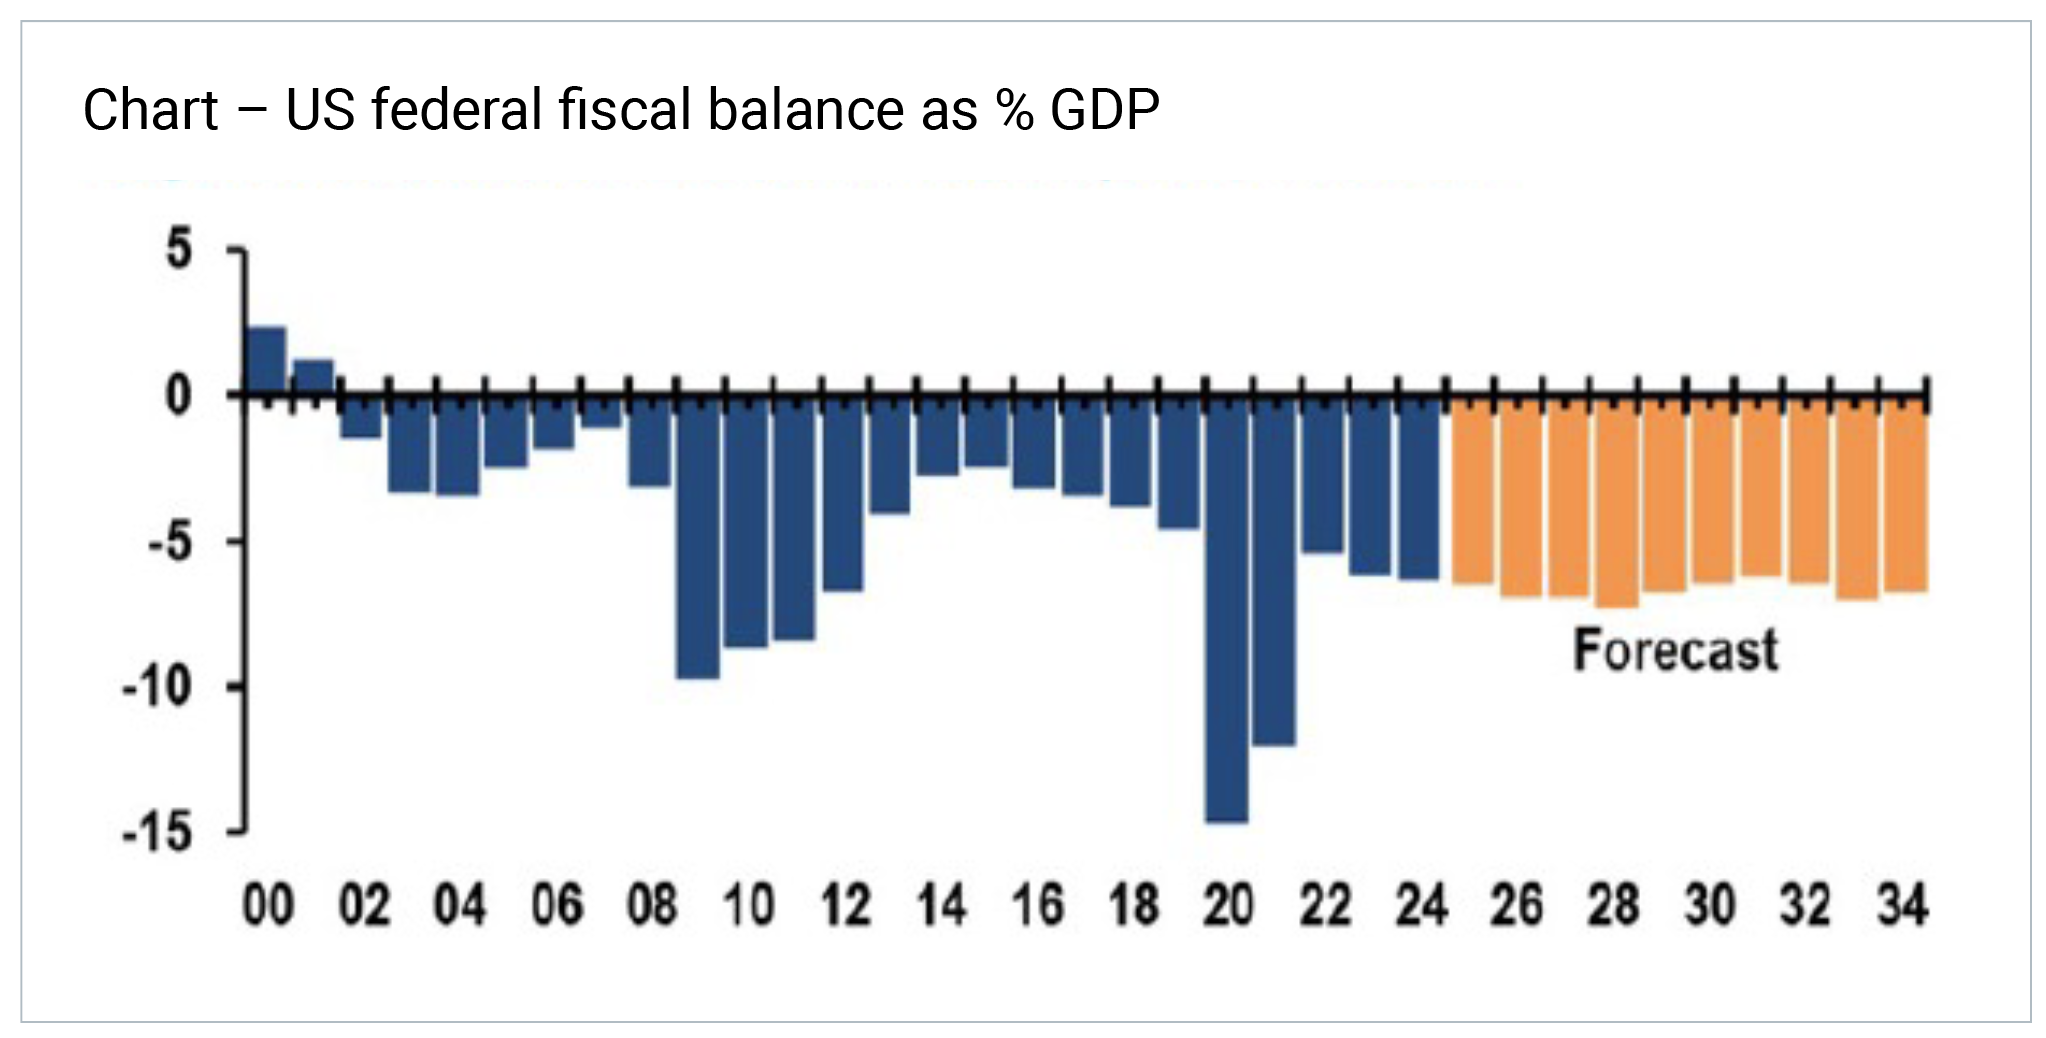
Theme 2 – OBBBA fiscal impact
OBBBA front loaded the fiscal impulse, which could offset some of the tariff headwinds.
 Source – Morgan Stanley
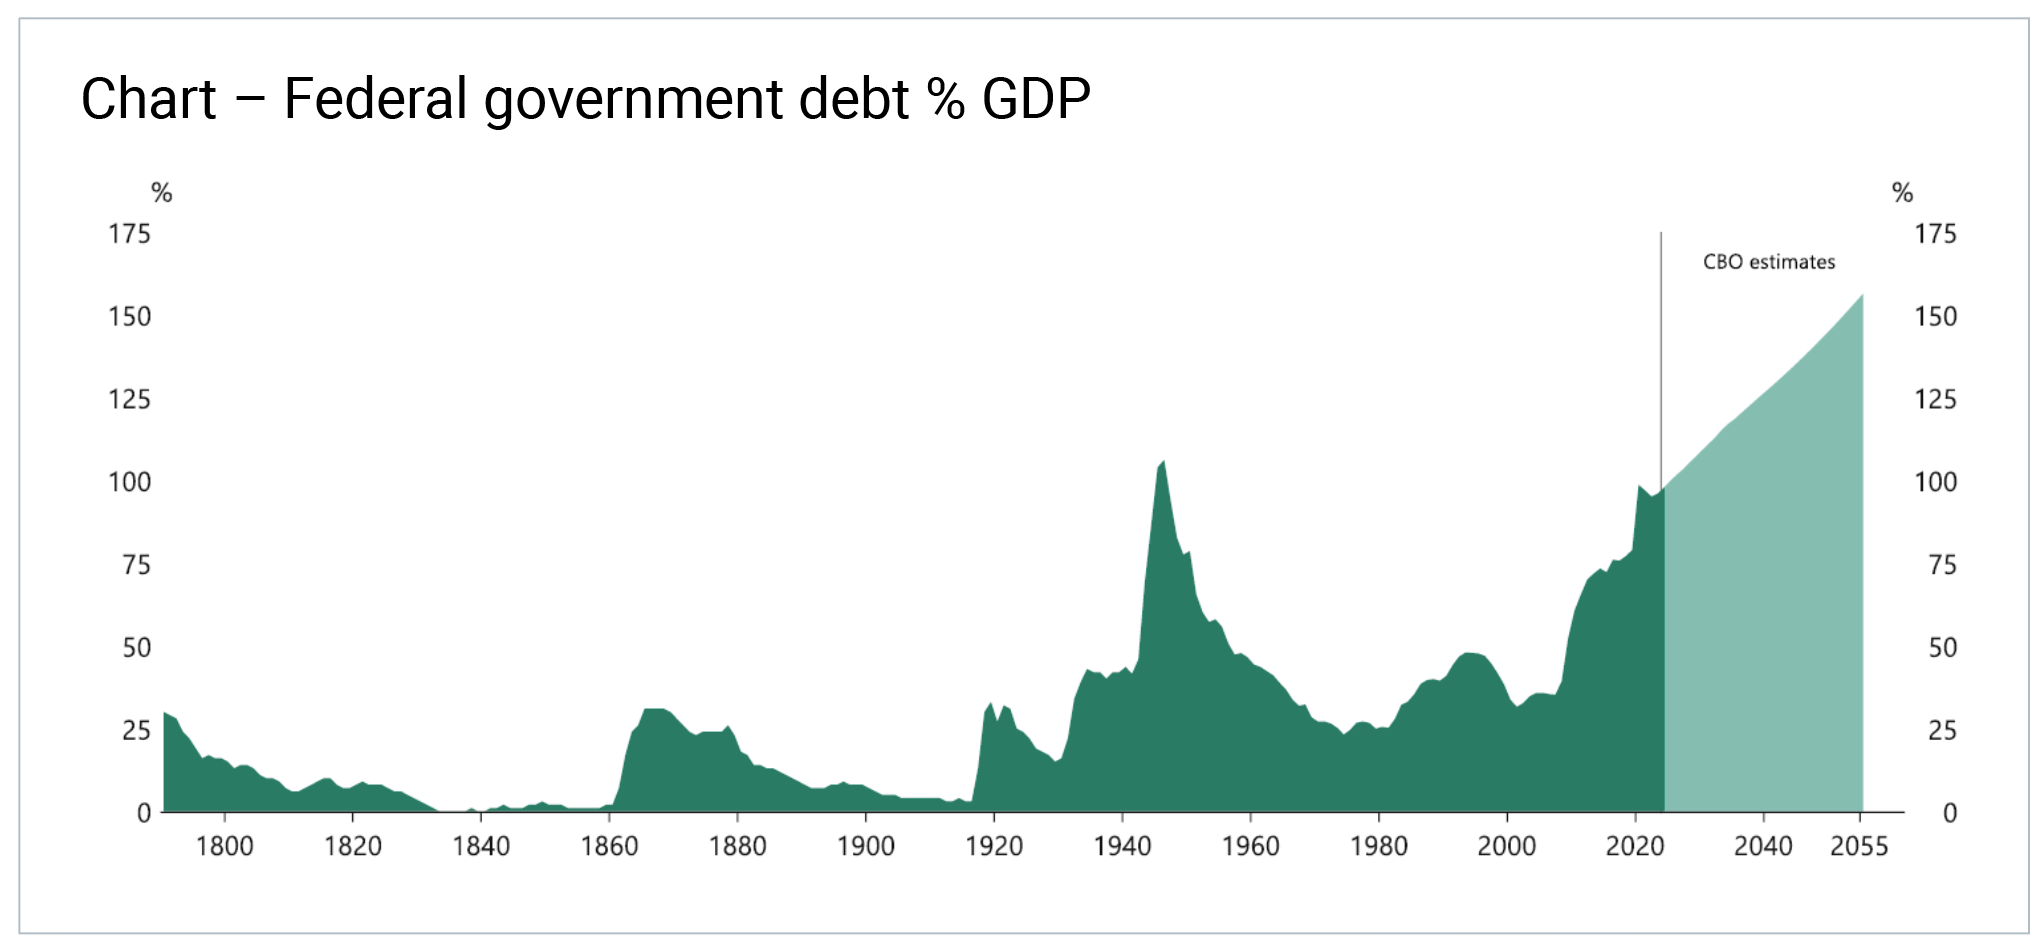
However, deficits are still large, and the trajectory is weak (from OBBBA).
 Source – JP Morgan
 Source – Apollo
Theme 3 – Economic uncertainty
Economic uncertainty remains very high – and this has a real impact on economic activity and investment.
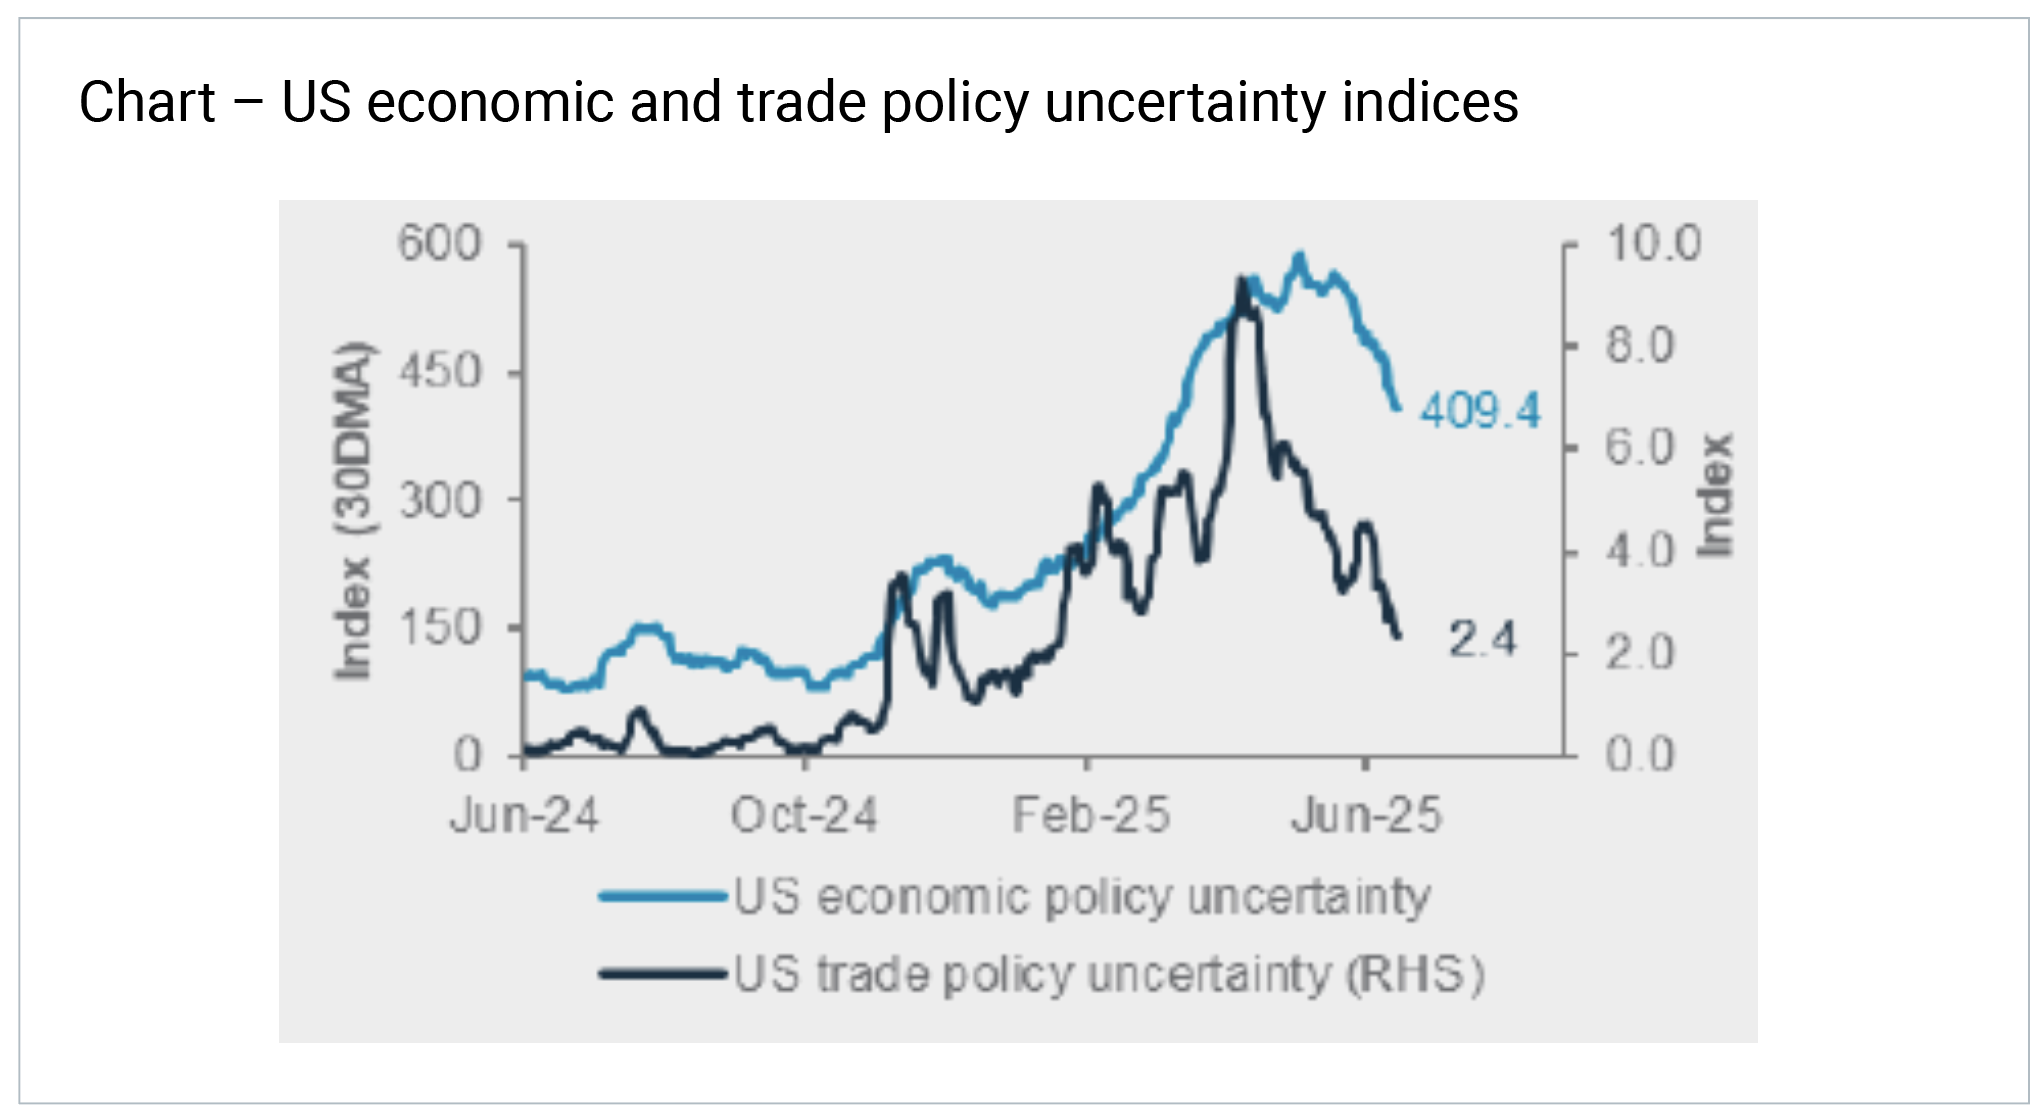 Source – Standard Chartered
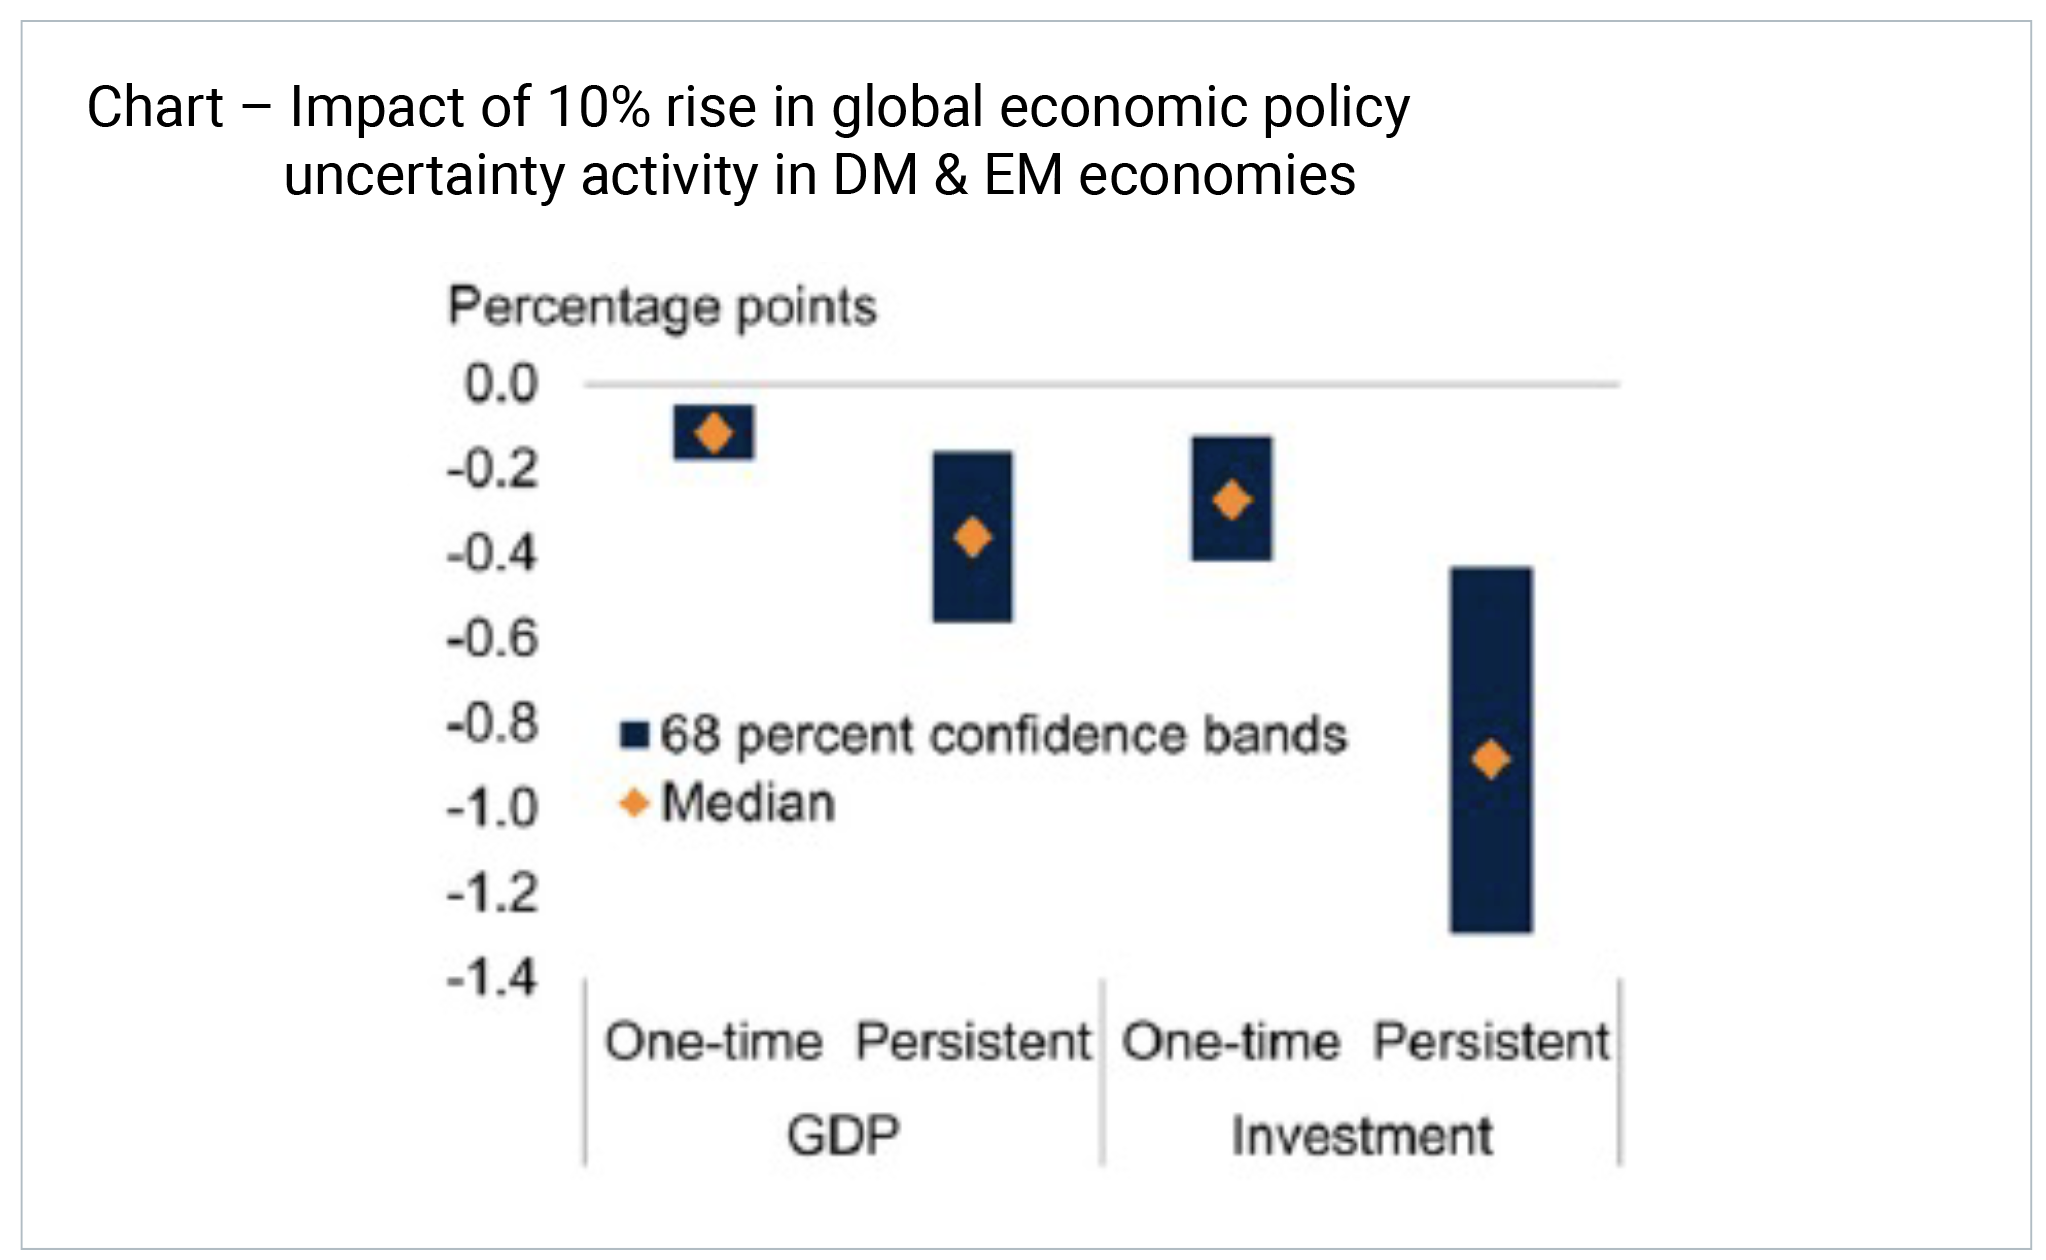 Source – World Bank
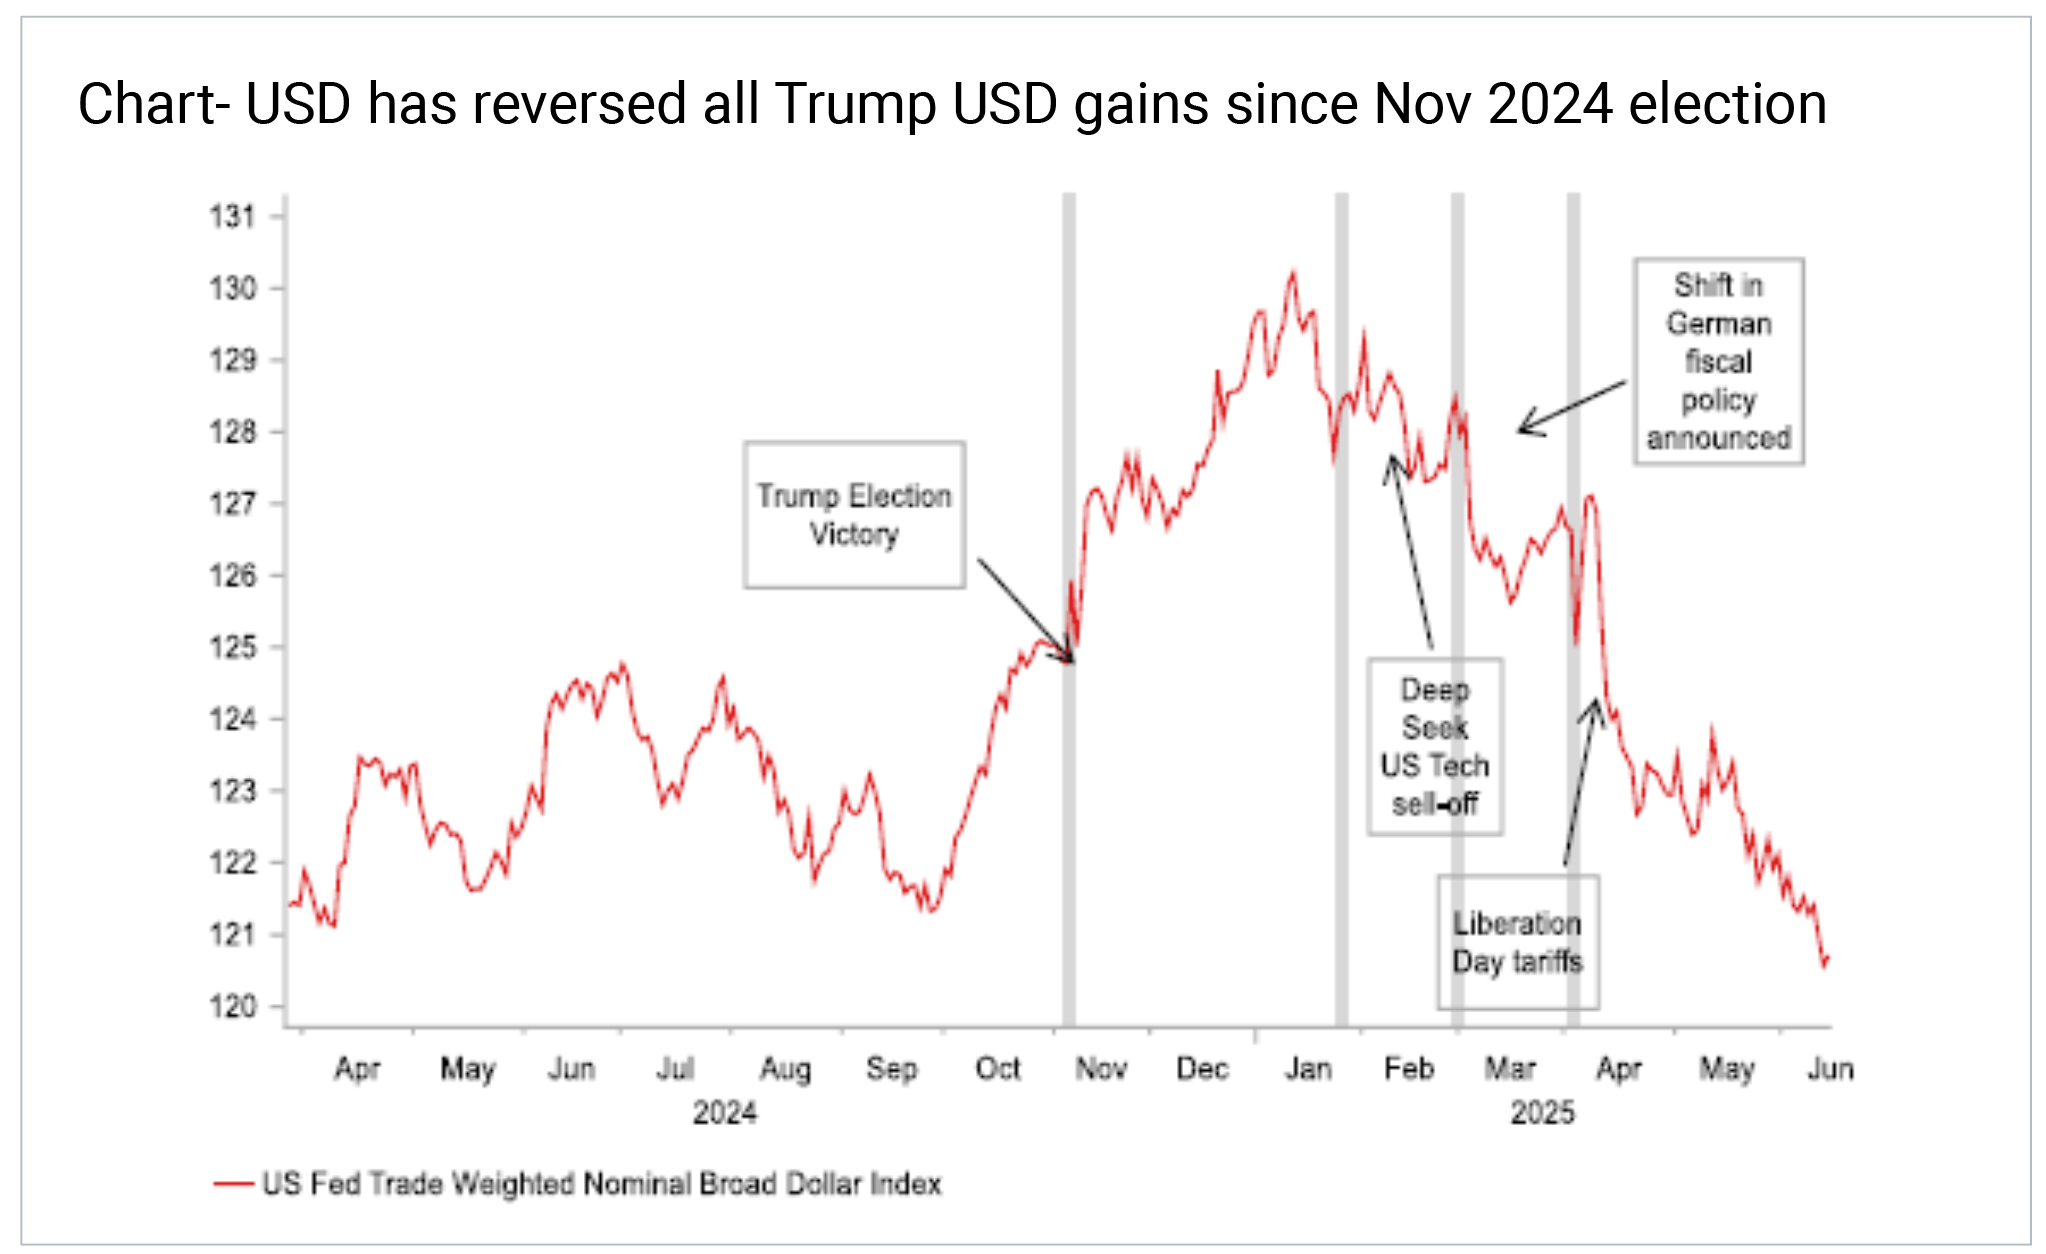
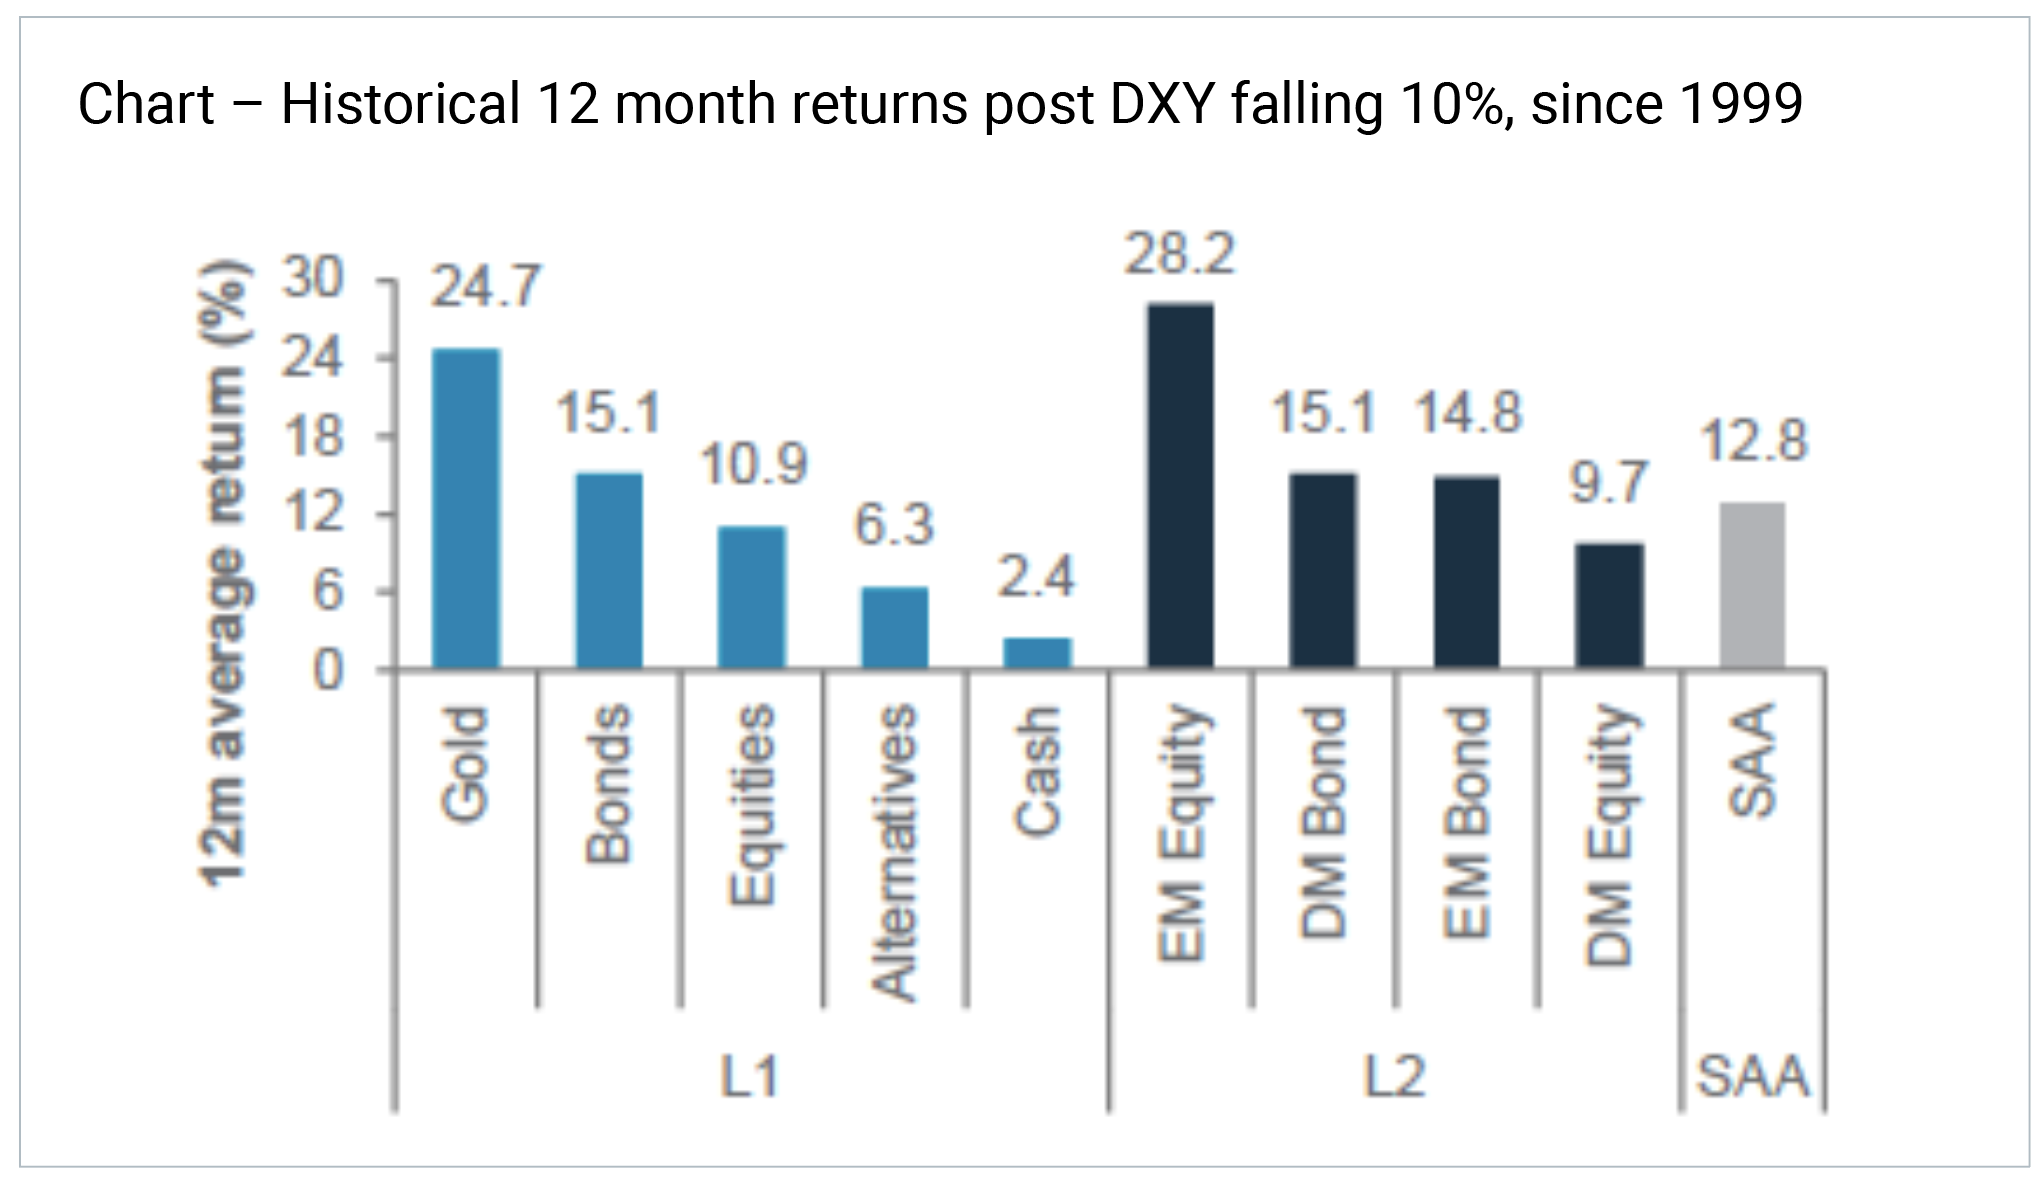
Theme 4 – Weaker USD
The USD has fallen 10% vs US Dollar Index (DXY) and trade weighted index (TWI). This is due to shorter term factors (elevated valuation, lower rate differential, tariff rollouts, trade policy) as well as longer term structural de-dollarisation trends (weak US fiscal outlook, central bank independence). Many would argue this is Trump’s key target and if so, he is succeeding.
 Source – MUFG
Importantly, history tells us that USD weakness is generally positive for EM equities.
 Source – Standard Chartered
Theme 5 – The TACO trade
Trump has made some swift backdowns in policies this year – enough to earn the title TACO. The trigger seems to have been when long bonds spiked and he has gotten spooked (90 day tariff pause, affirming Fed independence, backing down on high China tariffs). The long bond yield volatility remains important to watch in determining when the ‘Trump Put’ may next be triggered.
 Source – 4D, Bloomberg
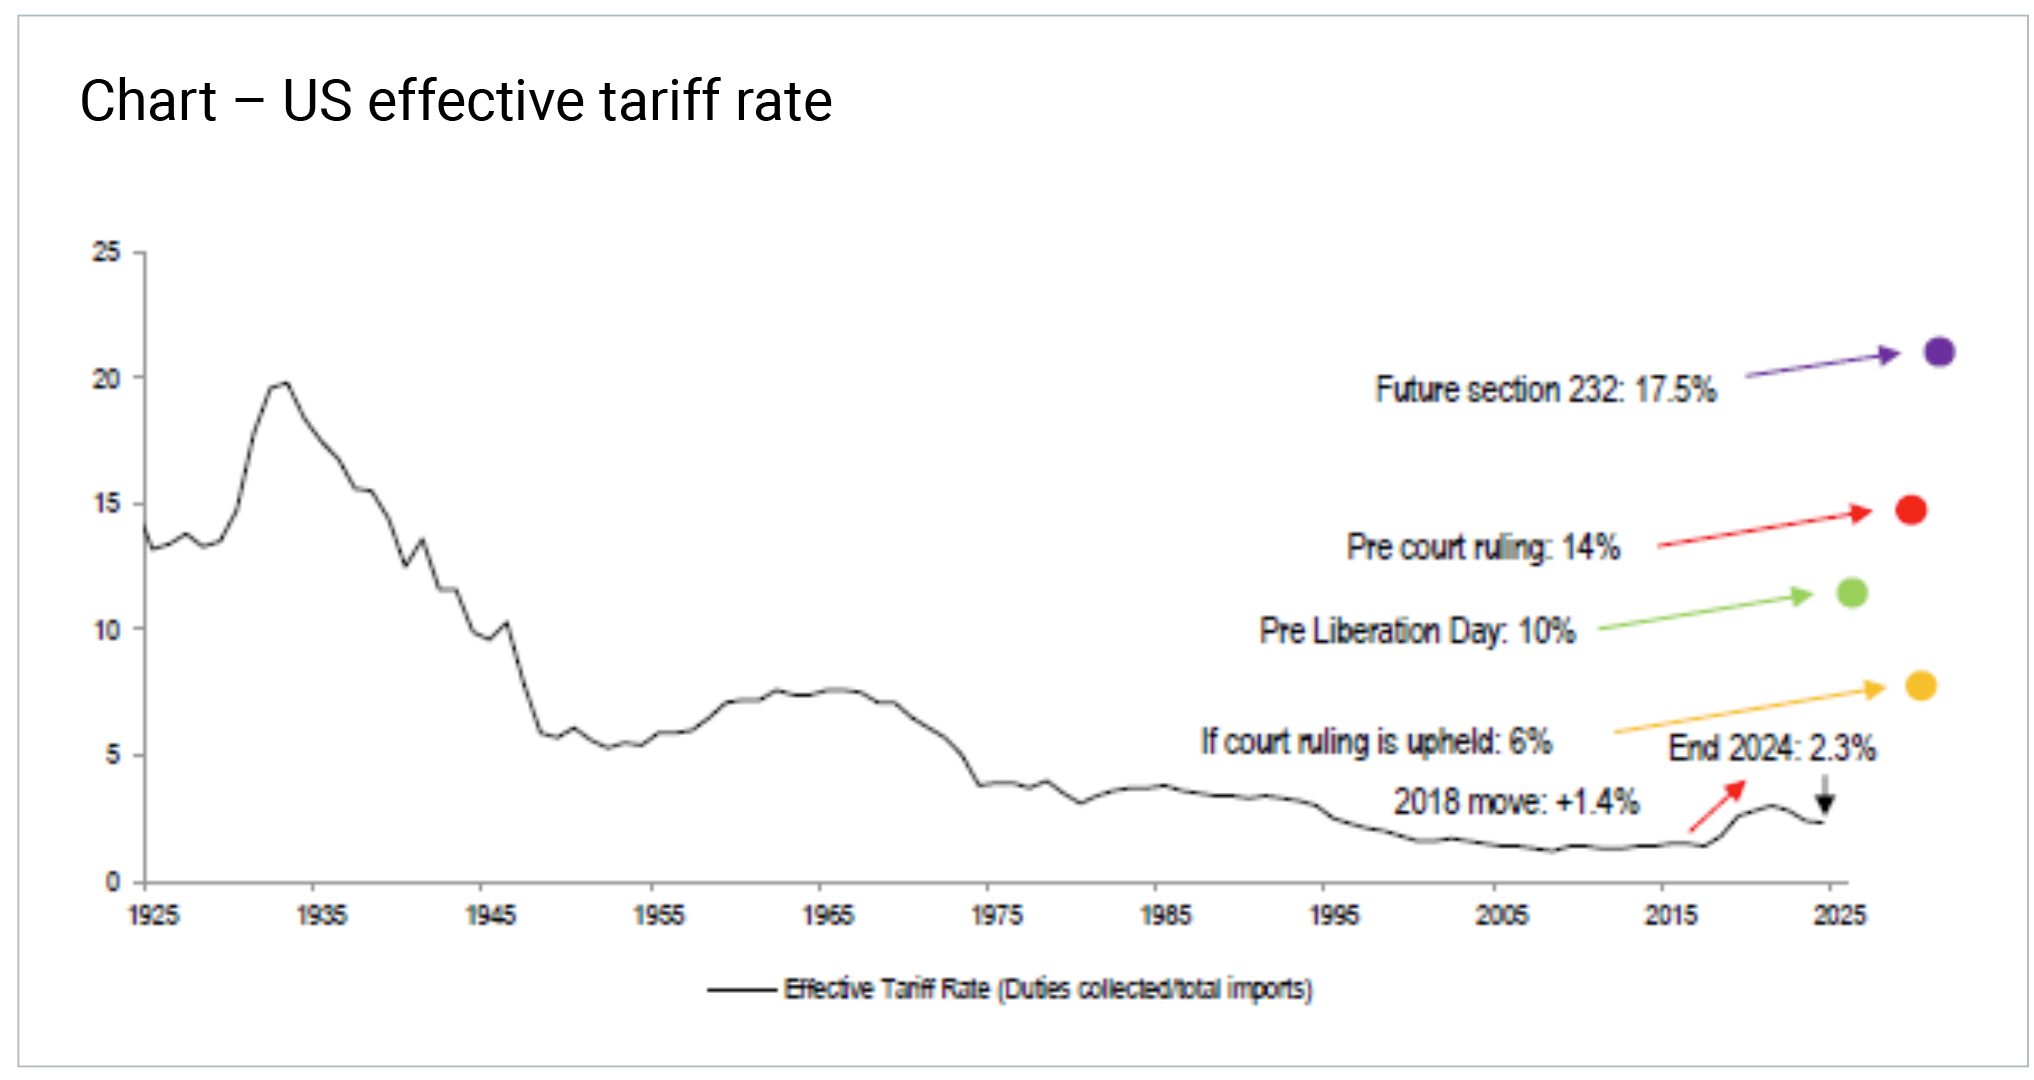
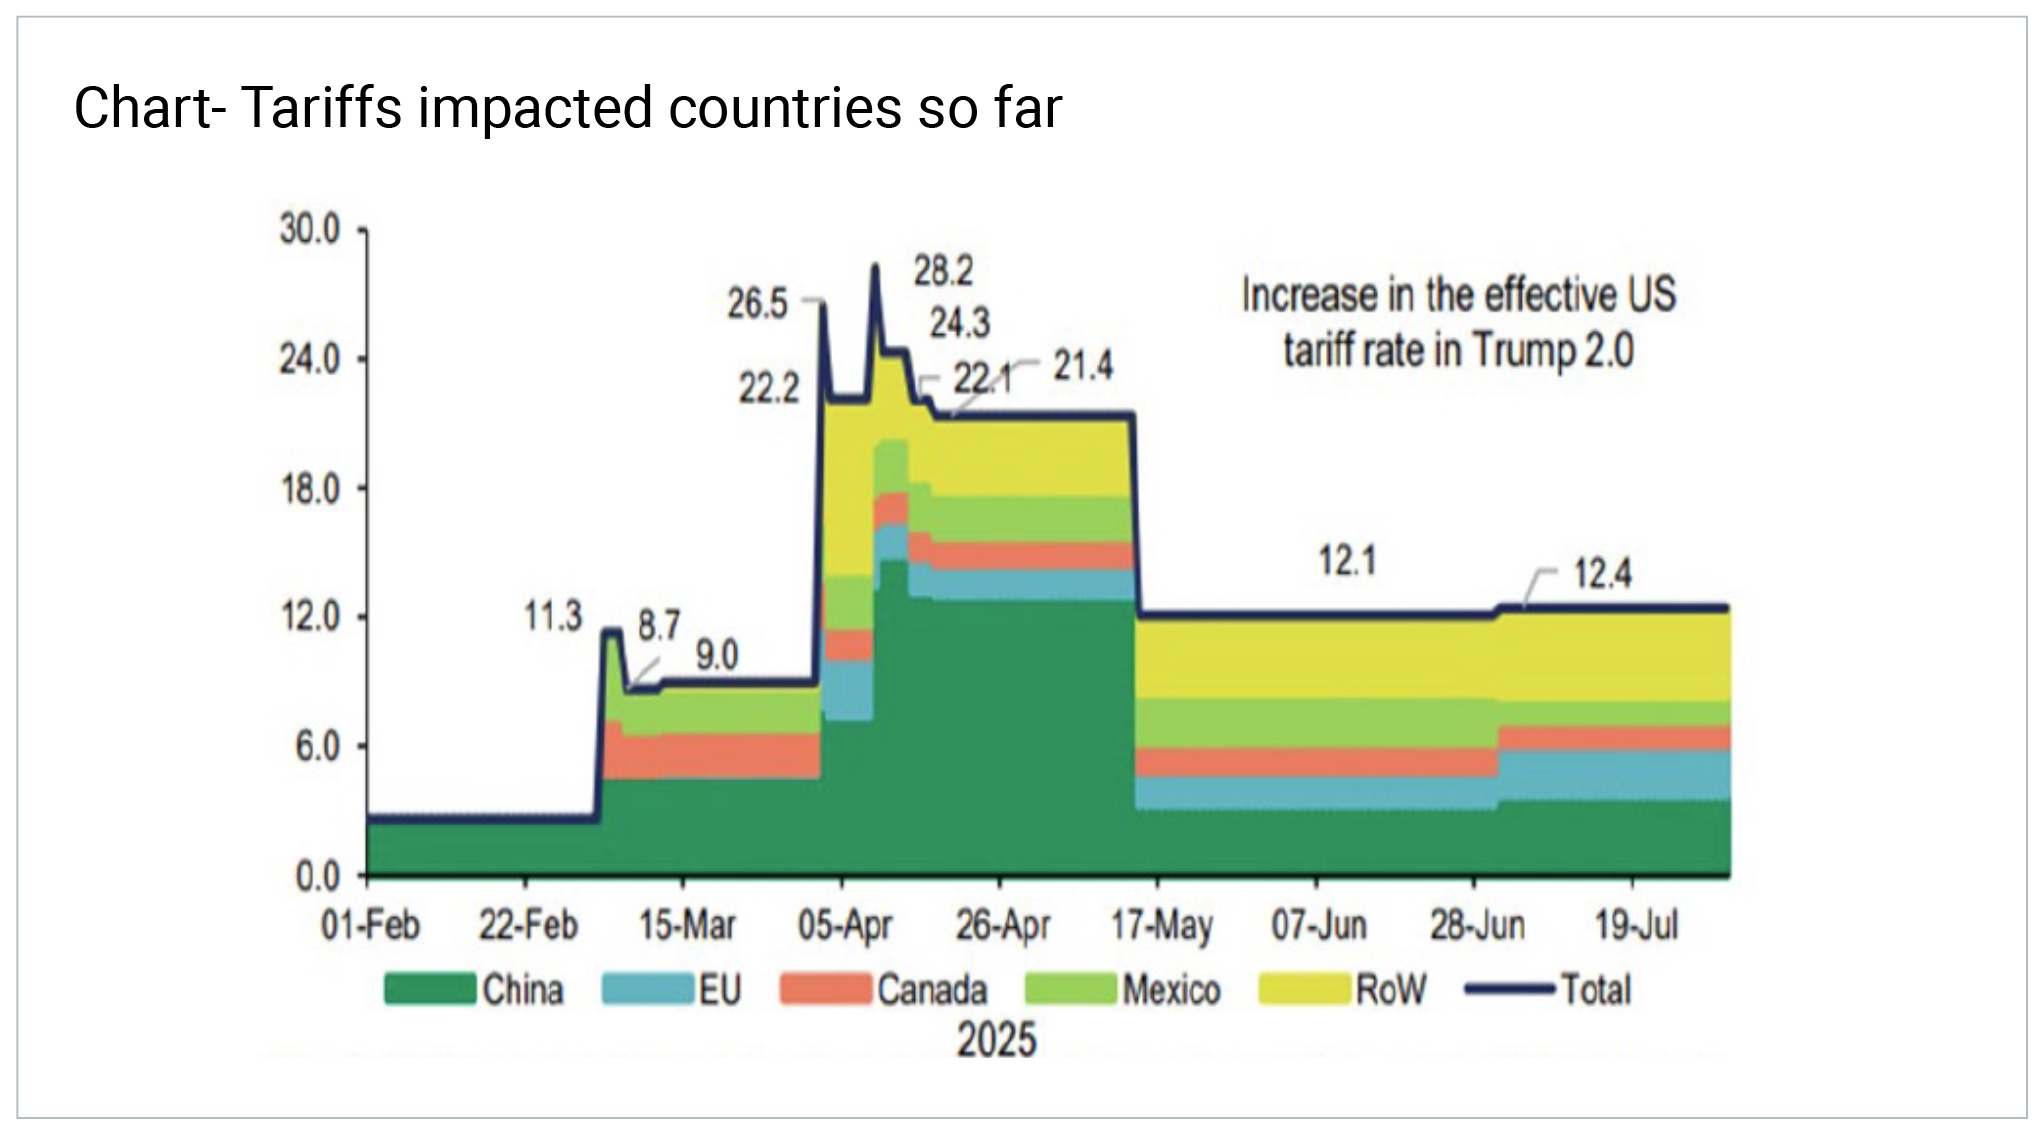
Theme 6 - Tariffs
Blended effective tariffs are now ~13%, up from 2.4% when Trump was elected last year. Even if we are past peak tariff fears on ‘Liberation Day’, tariffs remain a significantly elevated tax on US consumers and on corporate margins. This will eventually impact US supply chains, margins and inflation – expected to hit later in 2025/early 2026 as excess inventories are drawn down.
 Source- JP Morgan
 Source – BNP
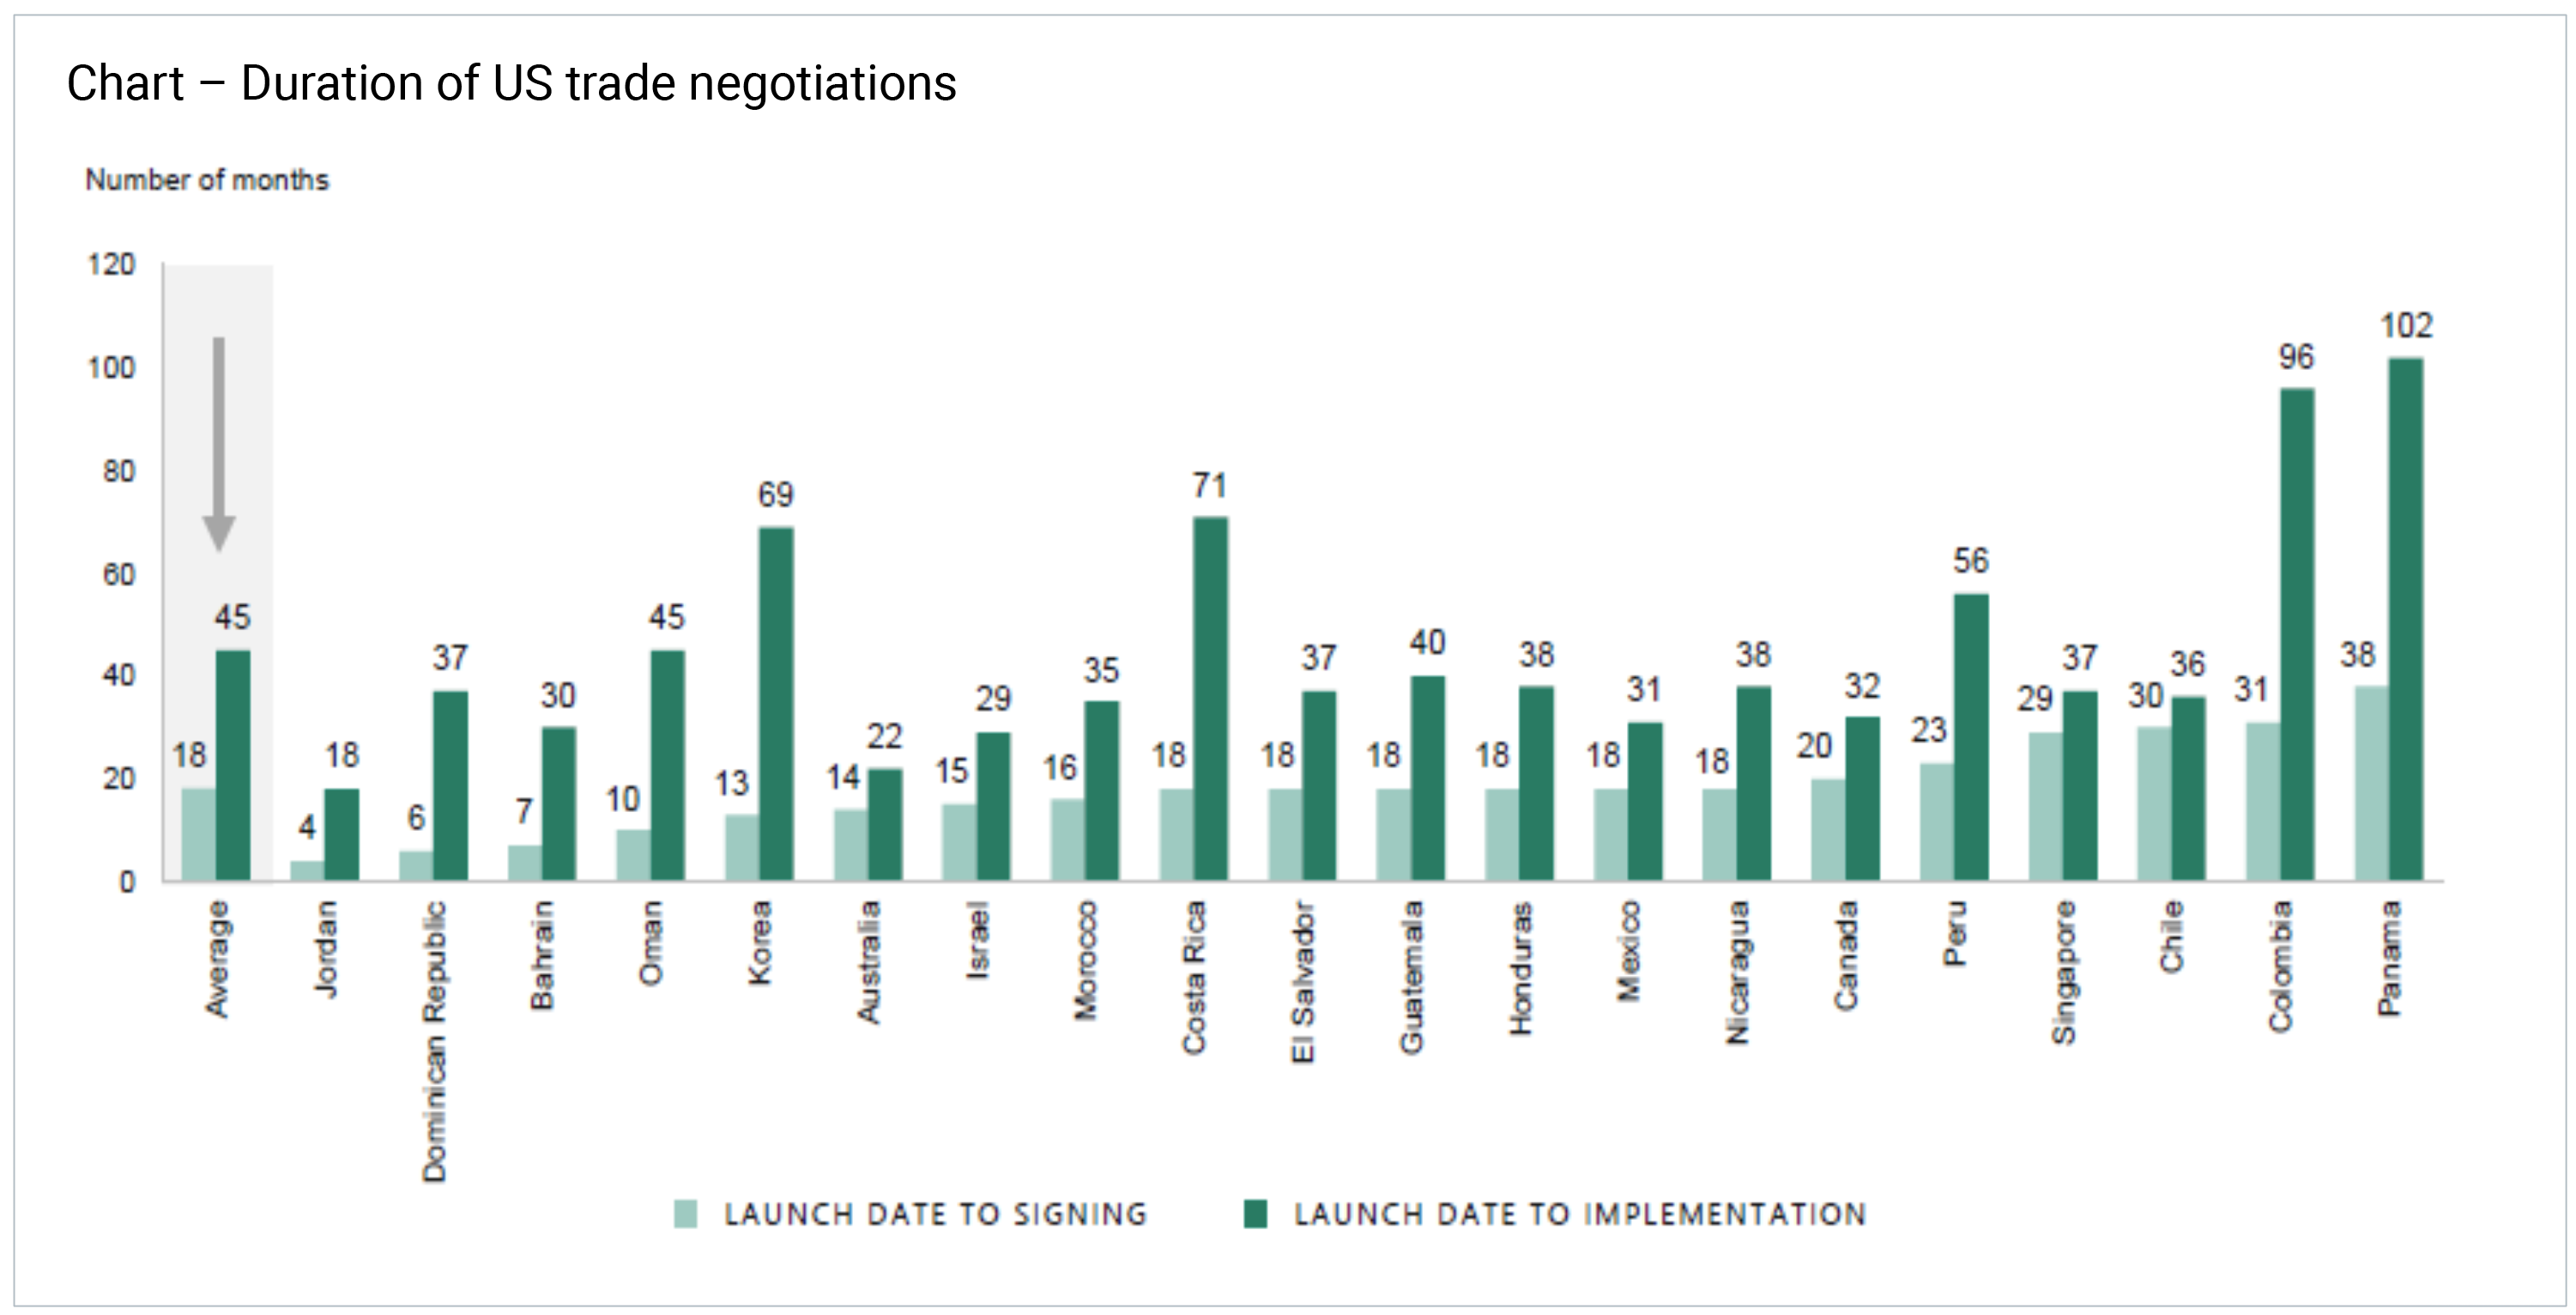
The confirmation of only three trade deals during Trump’s 90 day pause showed that getting all counterparties to agree on a new framework is very difficult and not necessarily all Trump’s way. Trade deals take time – on average 18 months from launch to signing and even longer to implementation – which shows we must reality check a lot of ‘quick deals’ fantasised by Trump. This uncertainty is set to last well through 2H 2025 and next year.
 Source- Apollo
What next for 2H 2025?
At a global macroeconomic and policy level, 4D believes there are several key areas to monitor that will drive markets for the rest of the year:
- 2025 will continue to be driven by heightened policy uncertainty, which should remain elevated. The longer that continues the greater the impact on the real economy, through lower GDP (via the consumer), worsening business sentiment and lower investment.
- The fourfold increase in US tariffs will start to impact US GDP and CPI at the end of 2025, with some offsets from the front loaded OBBBA fiscal benefit. Growth should still track at mid-1% which is higher than most advanced economies, but the risk is to the downside.
- Trump’s trade deals should drag on longer (not shorter) so we are wary of ongoing headline volatility. Countries and regions that can, will slowly realign supply chains and trade flows (Europe & South Asia) to their benefit. This could reduce Trump’s ultimate bargaining power.
- Watch 10- and 30-year yields spiking through 5%, for the ‘Trump Put’ to be triggered around major policy events.
- The bond market will become more sensitive to additional fiscal load on the US if Trump continues with any unfunded policies going forward. This should keep pressure on the USD, alongside continued attacks on Fed Chair independence.
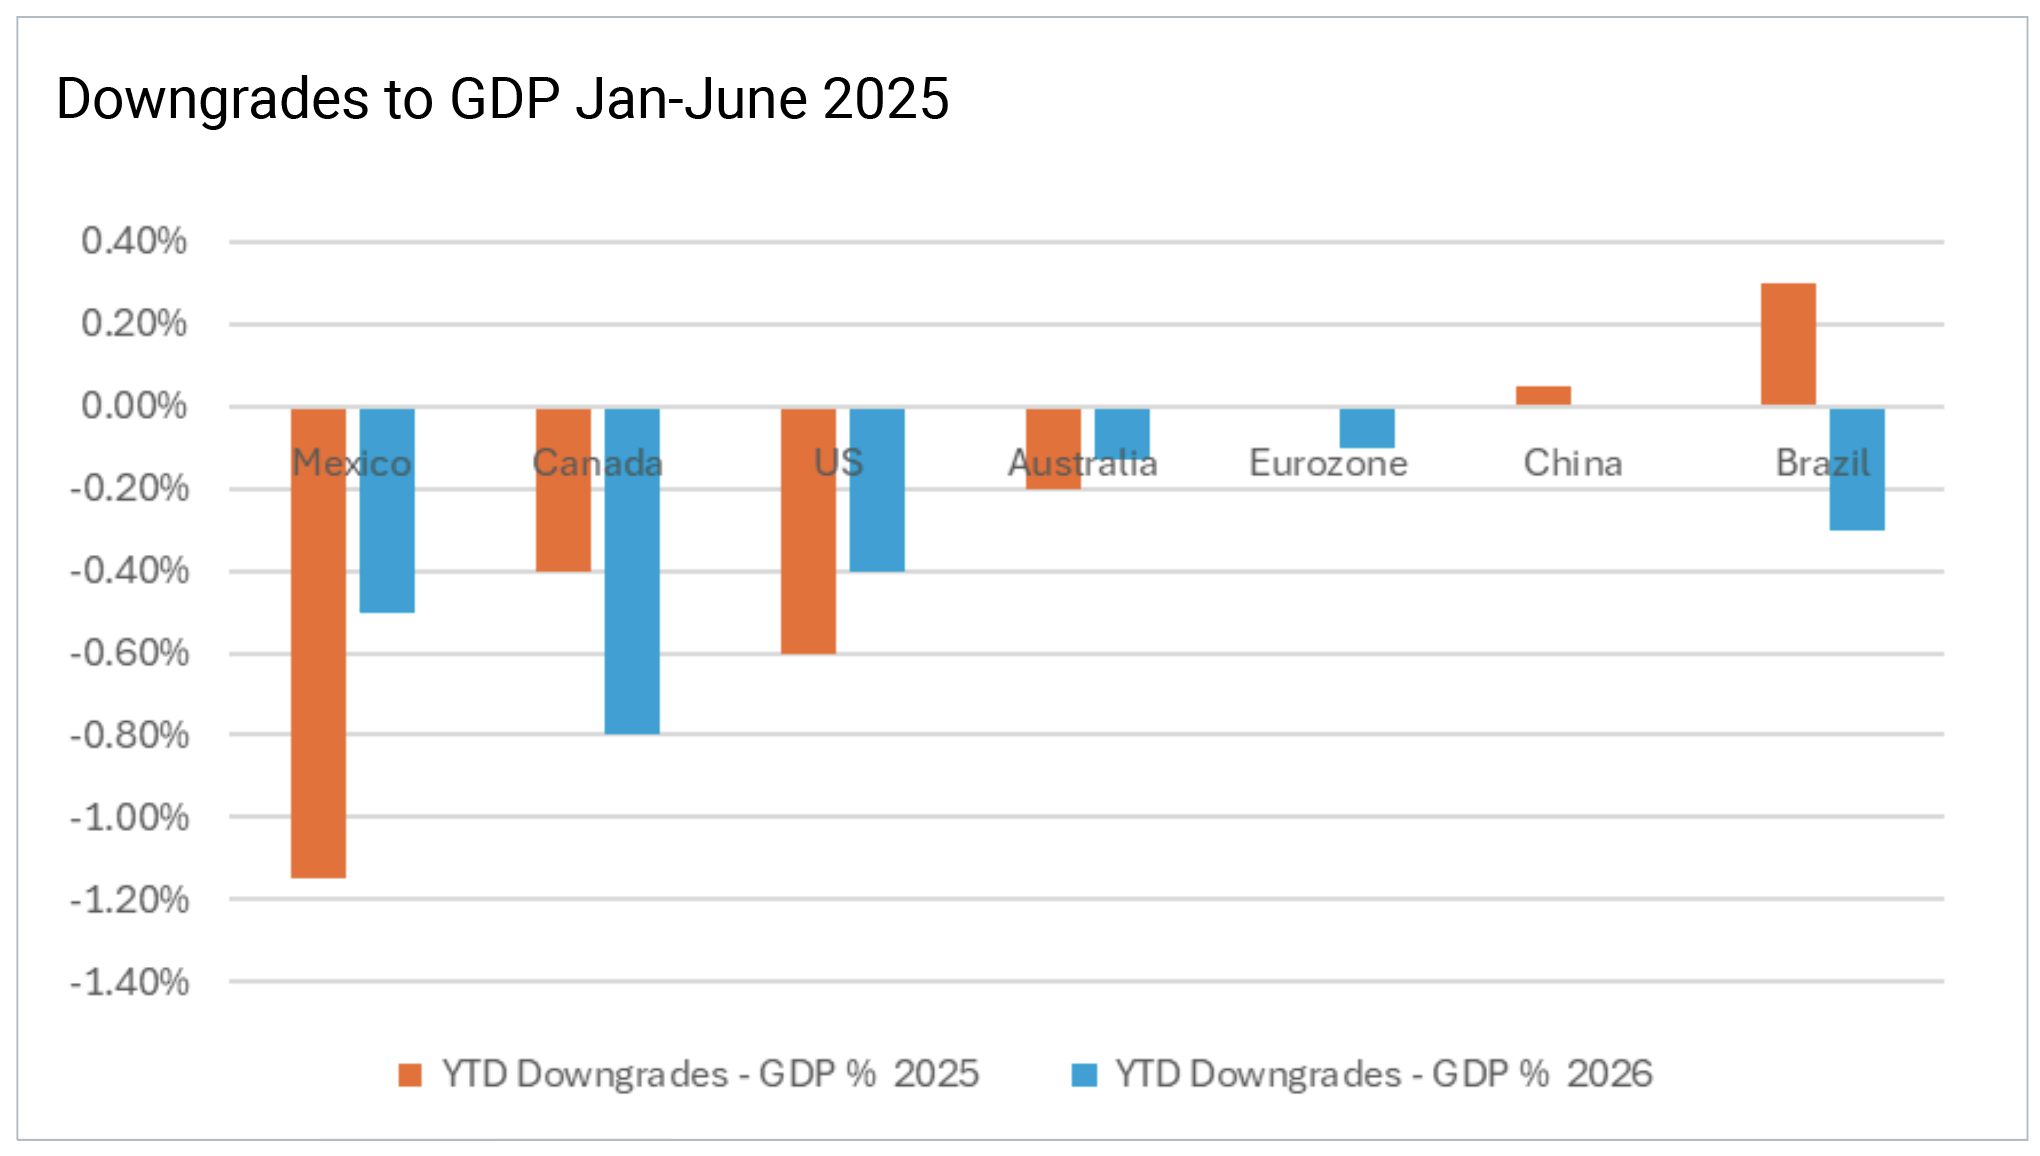
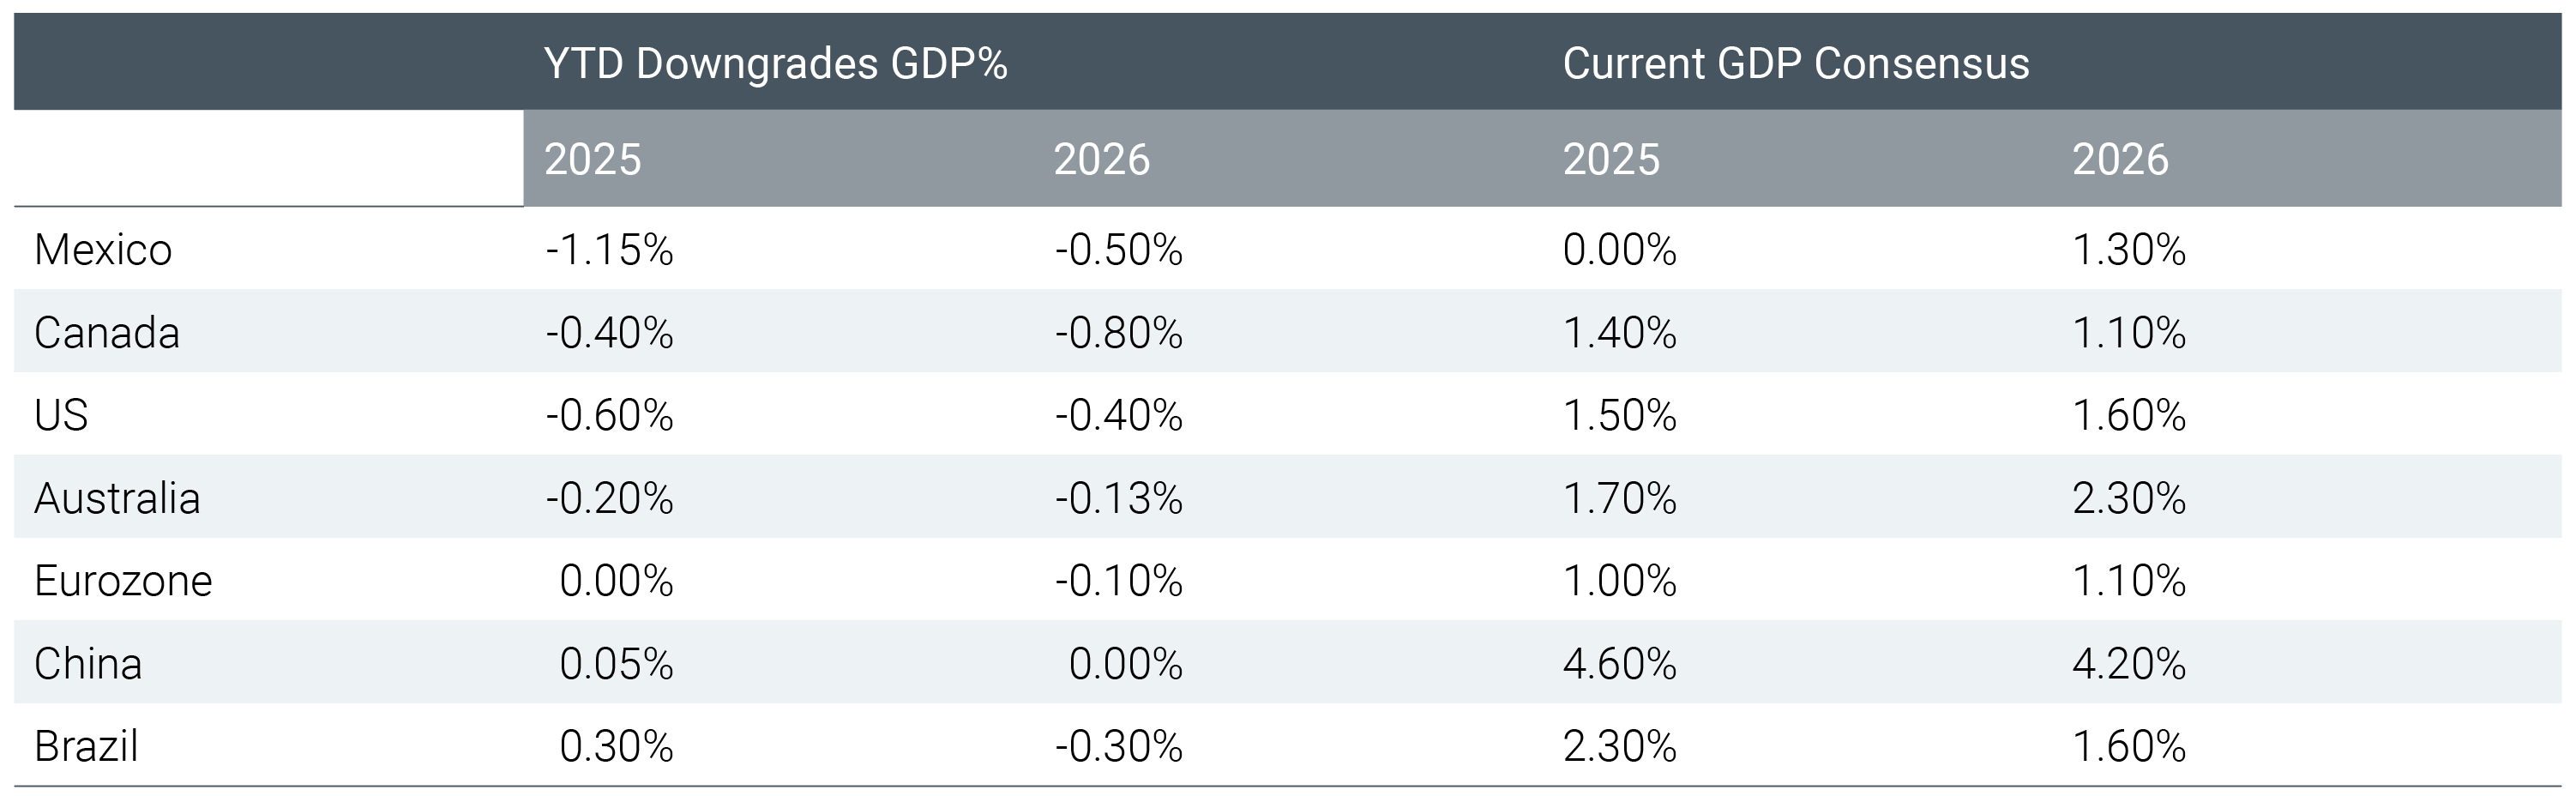
At a country level, we see diverging paths – on the economic and policy front – which are ripe conditions for active management around regional and sector allocation. This can be seen by the changes to 2025 and 2026 GDP forecasts across countries since the beginning of the year, with large downgrades to Mexico & Canada and flat/small increases to China & Brazil.
 Source – 4D, Bloomberg. Year End consensus forecasts for annual GDP change
At a country level we expect:
US: The year has seen weak soft data (consumer and business confidence) whilst hard data has shown resilience (labour market, CPI, activity). New orders have started to slow down, and the market has downgraded growth modestly for 2025 and 2026 (and upgraded CPI). The labour market has held up, where there has been low hiring but low firing. Wage gains of 3.9% running above inflation is good for consumption. Core CPI has behaved so far this year, but forward expectations are increasing due to tariff input costs.
Looking ahead, the delayed impact of higher tariffs on the economy are key to watch. This will come through via higher prices and lower activity. Also of concern is lower consumer confidence, Trump hitting tourism (10% of the economy) and there is a risk of a summer labour supply crunch due to deportations and immigration cuts. We expect ongoing pressure on the USD.
Canada: Canada has seen larger growth downgrades this year due to more elevated trade tensions, despite its USMCA membership. Employment has been weighing on household consumption and core CPI will start to increase in 2026. PM Carney’s role as a strongman against Trump will be important to watch over 2025’s trade concessions and as we enter re-negotiations for the 2026 USMCA deal with Mexico and the US – both to have a big impact on the Canadian economy and outlook. The Bank of Canada is being cautious around cuts with the unknown impact of tariffs on inflation and the economy.
Europe: European growth is mixed but overall remains weak, supported by an easing ECB, but positively with some fiscal green shoots into 2026. Europe remains exposed to China through exports, so tariffs are impacting Europe both directly and indirectly via potentially weaker trading counterparties. However, fiscally Europe has found reason for greater unity in a fragmented post-Trump world – and EU level defence spending, and country level programs are big tailwinds out to 2030 for the continent. There are also half of the EU Recovery Funds still to be spent over the next two years, with outsized benefit to the periphery nations from infrastructure spending.
Germany’s Chancellor Merz had a Mario Draghi-esque ‘whatever it takes’ moment on European defence, and lifted debt brakes to boost defence and infrastructure spending. This involved the creation of a €500bn infrastructure fund, as well as exempting defence spending above 1% of GDP from the debt brake (expected to add €400b of spending). These funds should boost both industrial and construction company earnings as they get deployed – and are expected to boost Germany’s GDP by up to 2% to 2030.
Spain’s growth remains strong in comparison to the weaker core, driven by domestic consumption and real wage growth. This is despite a political impasse. In Italy, there is progress on fiscal consolidation whilst there are some green shoots with construction spending and investment. France’s growth has been hit by export uncertainty and fiscal tightening (-1% to a 5% deficit, the largest cut in a decade) as well as the overhang of political disharmony.
UK: Strength in Q1 has reversed in Q2 with trade worries and higher taxes weighing on the UK. Service sector inflation remains sticky due to high wage growth, but the labour market is slowly cooling. The BoE is slowly easing to support the tepid growth despite the stickier inflation outlook.
China: China has been boosted by tariff frontloading, seen in its strong export volumes. Domestically, consumer trade-in subsidies have led to a surge in appliance, furniture and electronics sales (+39% YoY) but this programme is coming to an end. Real estate remains weak and there is ongoing disinflation and deflation concerns hitting the consumer and businesses. Savings rates remain high. China still has fiscal firepower depending on how its trade discussions progress, but it is a positive that US agreed on a trade framework in June.
Brazil: Growth is slowing but still solid as restrictive monetary policy takes hold. Peak rates at 15% should see inflation expectations come down and the BCB to start lowering rates early next year. This is ahead of important October 2026 presidential elections. Fiscal vulnerabilities remain important to watch, with the government’s fiscal discipline around 0% primary deficit important to track.
Mexico: Growth has been hit this year and is tracking close to 0% YoY. Sheinbaum is undergoing the largest fiscal restriction in a decade (2%) in the backdrop of higher tariffs and economic uncertainty with key trading partners. After initial concerns, she does seem to be managing the environment well, but this is one to watch.
What about global listed infrastructure?
The backdrop is one of elevated economic and trade uncertainty, larger divergences between countries’ growth, CPI and policy rate paths, and large currency moves. This environment has allowed 4D as an index unaware active global listed infrastructure manager to take advantage of the opportunities and mitigate the risks we see across sectors and regions:
Europe: We believe the backdrop is positive for continued European outperformance (in global listed infrastructure equities), particularly leading into the new year as we see the German fiscal war chest start to be deployed. The structural infrastructure thematics continue to grow with our names benefiting from ongoing travel buoyancy, growing demand for energy security, and accelerating digitisation. We remain overweight Europe.
LatAm: Brazil remains somewhat isolated from the tariff war, being a trade surplus counterparty to the US. This is despite Trump’s risks of imposing higher tariffs for political concessions. It also started the year in a very oversold position on domestic concerns which are slowly easing. We remain overweight Brazil. Mexico will remain under pressure this year, and we have limited our exposure to sectors that can mitigate the headwinds.
North America: US long bond yields should stay elevated, which will weigh on US utilities despite cash rates heading lower. Rails have seen volumes hold up YTD with the frontloading activity of the first half, but the outlook into H2 is more uncertain (depending on where tariffs land and the US economy). Midstream benefits from Trump policies but could be impacted by lower global oil prices and lower demand. Canada remains under pressure from economic weakness and critical trade negotiations. We remain underweight North America.
China: China retains fiscal firepower should the trade war get ugly, but the economy is still undergoing the large property sector slowdown. This continues to weigh on household spending (savings rates are still high) and business confidence (through investment). China remains a market with pockets of deep value too large to ignore, and we have selective exposure.
Emerging markets: 4D has the capacity and capability to be active in emerging markets. A weakening USD should be a tailwind for emerging market equities with infrastructure names a strong way to capitalise on domestic demand while hedging core risks of inflation and sovereign policy. We remain overweight emerging markets.
Conclusion
The first half of 2025 has been a volatile period for markets, but the core characteristics of infrastructure have offered relative safety and stability. 4D remains acutely aware of the fundamental reshaping of macroeconomic dynamics across economies and geopolitics because of Trump’s ‘America First’ policies. We continue to capitalise on opportunities and mitigate risks - both in the short and long term - through active portfolio management across regions and sectors.
The content contained in this article represents the opinions of the authors. This commentary in no way constitutes a solicitation of business or investment advice. It is intended solely as an avenue for the authors to express their personal views on investing and for the entertainment of the reader.